Search Results
Showing results 81 to 100 of 156

Go with the Flow
Source Institutions
In this quick and easy activity and/or demonstration, learners use two empty soda cans to illustrate Bernoulli's principle.
Fish Eyes: More than Meets the Eye
Source Institutions
In this data collection and analysis activity, learners evaluate fish physiology and ecology using vision research data from Dr.

Fill it to Capacity
Source Institutions
In this math lesson, learners rotate through six estimating and measuring centers. First, learners read the book, "Room for Ripley" by Stuart J.
What Do Birds Do?
Source Institutions
This activity (located on page 3 of the PDF) is a full inquiry investigation into bird behaviors.
Counting Your Lucky Stars
Source Institutions
In this activity, learners sample a star field to estimate the number of stars in the universe.
Fish Family Identification
Source Institutions
In this game, students will become familiar with fish shapes, learn that fish within a given taxonomic family have similar body shapes, and discuss how different body shapes enable fish to survive in

The Daily Ups and Downs
Source Institutions
In this activity, learners graph 48 hourly air temperatures from a local weather observation site and observe the diurnal temperature variations.

Dicey Directions
Source Institutions
In this game, learners are stuck in a right turn only world! Learners take turns rolling a die and moving their game pieces along the lines of a grid to get "home," by only making right turns.
Updrafts in Action
Source Institutions
In this weather activity/demonstration, learners watch as a ping pong ball is suspended in a stream of air supplied by a hair dryer.
Human Interface Design: The Chocolate Factory
Source Institutions
In this activity about human interface design issues, learners help the Oompa-Loompas of a great chocolate factory solve different problems.
Super Memory
Source Institutions
In this activity (pages 26-29 of the PDF), learners investigate how they can develop super memories by using mnemonic devices.
Haunted by Hurricanes: Use Data to Learn About Hurricanes
Source Institutions
In this activity, learners will determine if the frequency and intensity of hurricanes are changing using real data from the National Hurricane Center.
The Return of El Nino
Source Institutions
In this activity related to climate change and data analysis, learners examine temperature and precipitation data to determine if climate variations are due to El Niño.
The Carbon Cycle: How It Works
Source Institutions
In this game, learners walk through an imaginary Carbon Cycle and explore the ways in which carbon is stored in reservoirs and the processes that transport the carbon atom from one location to another

Nano Scavenger Hunt
Source Institutions
This is an activity (located on page 3 of PDF under Where's Nano? Activity) about identifying nanoscale objects and phenomena in today's world.
Number Patterns
Source Institutions
In this lesson, learners are challenged to discover the relationship among six numbers.
Diatom Ooze: Ooze Clues
Source Institutions
In this activity, learners will plot the distribution of various oozes using information from sediment maps.

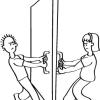
Pitch, Roll and Yaw: The Three Axes of Rotation
Source Institutions
In this activity (page 87 of the PDF), learners move their bodies to better understand the three axes of rotation: pitch, roll and yaw.
Conductivity: Salty Water
Source Institutions
Water, whether fresh or salty, serves as one of the best electrical conductors on the planet. Does salt effect its conductivity?
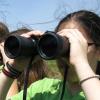
The Sharp Eyes of a Naturalist
Source Institutions
In this creative activity, learners will practice looking carefully to observe details and to become familiar with dioramas as a method for displaying naturalistic scenes.