Search Results
Showing results 1 to 16 of 16
Let's Count Humpback Whales: Environmental Effects on Population
Source Institutions
In this activity, learners use whale count data from the Hawaiian Islands Humpback Whale National Marine Sanctuary to compare whale counts in relation to environmental factors.
Natural Selection in Protected and Unprotected Populations
Source Institutions
In this simulation, learners model two elephant seal populations and how they change over time. Learners start with cards representing a variety of seals.
Catch & Release II: It's Catching On!
Source Institutions
Throw that fish back? A new generation of ethical anglers concerned about conserving resources is participating in "catch and release" fishing. How is this going?
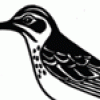
Mapping Mockingbirds
Source Institutions
This lesson plan revolves around studying the speciation of the Galápagos mockingbirds, which are on display at the California Academy of Sciences.
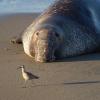
For the Birds: Environmental Effects on Population
Source Institutions
In this activity, learners will investigate how shorebirds and seabirds are extremely vulnerable to changes in their environment, whether human-induced or otherwise.
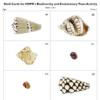
Biodiversity and Evolutionary Trees
Source Institutions
In this interactive activity, learners analyze seashells to explore phylogeny and evolution. Learners identify similar and dissimilar seashells to create a phylogenetic tree.

Coral Snapshots: Biodiversity in Marine Protected Areas
Source Institutions
In this data activity, learners analyze data from coral reef snapshots taken by scientists at the Virginia Institute of Marine Science.
Pósteres Sobre Animales y Matemáticas
Source Institutions
Exponga estos pósteres en el salón o déjelos donde los chicos los puedan explorar. Los chicos buscan las respuestas en libros de consulta o en línea.
Fish Eyes: More than Meets the Eye
Source Institutions
In this data collection and analysis activity, learners evaluate fish physiology and ecology using vision research data from Dr.
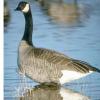
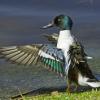
Canada Goose: Explore Trends With Data
Source Institutions
In this activity, learners will explore trends in Canada goose populations using real data from the National Audubon Society's Christmas Bird Count.
Harmful Algal Blooms: In Full Bloom
Source Institutions
In this activity, learners will investigate the impacts of harmful phytoplankton using NOAA's Coastal Services Center Harmful Algal Bloom Forecasting (HABF) Project data.
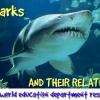
Sharks: Taking a Bite Out of The Myth
Source Institutions
In this activity, learners will explore trends in shark populations using shark landing data from the National Marine Fisheries Service.
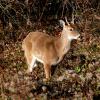
Population Study Game: Oh, Deer!
Source Institutions
In this activity, learners model a population of deer and see how the number of deer changes over time.
Slowing the Flow
Source Institutions
In this experiment, pairs of learners explore how cold water affects circulation. The mammalian diving reflex (MDR) slows circulation when the body is exposed to cold water.

The Dead Zone: A Marine Horror Story
Source Institutions
In this environmental science and data analysis activity, learners work in groups to track a Dead Zone (decreased dissolved oxygen content of a body of water) using water quality data from the Nutrien

Sustainable Grazing
Source Institutions
In this activity, learners investigate the food, water, and space needs of common livestock animals.