Search Results
Showing results 1 to 20 of 60
Perspectives: Powers of 10
Source Institutions
In this activity, learners complete a series of drawing activities to explore scale and powers of 10. Learners first trace each other on 1-meter-square pieces of paper.

Measuring Your Breathing Frequency at Rest
Source Institutions
In this activity about the brain and sleep (on page 138 of the PDF), learners measure their resting breathing rates. Learners will discover that breathing frequencies vary amongst individuals.
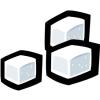
Investigating Density Currents
Source Institutions
In this lab activity, learners explore how to initiate a density current. Learners measure six flasks with different concentrations of salt and water (colored blue).
The Blindfolded Walk
Source Institutions
In this activity, learners work in teams to study the observation skills essential to scientific research.
Now or Later: The "Recency/Primary" Effect
Source Institutions
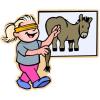
In this activity (18th on the page), learners conduct an experiment to examine memory.
How Far?
To learn how friction affects motion, learners build a measurement tool from a rubber band and other simple materials.
The Space Place
Source Institutions
In this activity (23rd on the page), learners conduct an experiment to examine memory and learning.

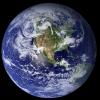
Earth's Energy Cycle: Albedo
Source Institutions
In this activity, learners experiment and observe how the color of materials that cover the Earth affects the amounts of sunlight our planet absorbs.

How Quick Are Your Responses?
Source Institutions
In this activity (on page 134 of the PDF), learners explore reaction time.
Measuring Your Blind Spot
Source Institutions
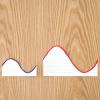
In this activity, learners calculate the width (horizontal diameter) of the blind spot on their retina. Learners make a blind spot tester using a piece of notebook paper.
Sea State: Forecast Conditions at Sea
Source Institutions
In this oceanography and data collection activity, learners cast real time sea state conditions using buoys from NOAA's National Data Buoy Center.

Percentage of Oxygen in the Air
Source Institutions
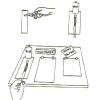
In this activity, learners calculate the percentage of oxygen in the atmosphere by using steel wool's ability to rust.

Critical Angle
Source Institutions
In this optics activity, learners examine how a transparent material such as glass or water can actually reflect light better than any mirror.
Soap-Film Interference Model: Get on our wavelength!
Source Institutions
By making models of light waves with paper, learners can understand why different colors appear in bubbles.
Rate of Solution Demonstration
Source Institutions
In this chemistry demonstration, learners investigate the factors that increase the rate of dissolution for a solid.
Understanding Albedo
Source Institutions
In this activity related to climate change, learners examine albedo and the ice albedo feedback effect as it relates to snow, ice, and the likely results of reduced snow and ice cover on global temper
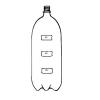
Under Pressure
Source Institutions
In this experiment, learners examine how pressure affects water flow. In small groups, learners work with water and a soda bottle, and then relate their findings to pressure in the deep ocean.
The Drake Equation
Source Institutions
In this math activity, based on the research of famed astronomer Frank Drake, learners calculate the possibilities of finding intelligent life elsewhere in the universe besides Earth.
The Shadow Knows II
Source Institutions
In this activity, learners will measure the length of a shadow and use the distance from the equator to calculate the circumference of the earth.