Search Results
Showing results 21 to 40 of 57

Chilean Sea Bass: Off the Menu
Source Institutions
In this data analysis activity, learners use data collected by the Commission for the Conservation of Antarctic Marine Living Resources (CCAMLR) to study Chilean sea bass populations.
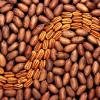
The Right Fit
Source Institutions
In this math activity, learners trace their hands and estimate the number of beans that can fit into their hand tracings. Then, learners glue the beans to the tracing to test out their estimations.
Energy Sources
Source Institutions
In this activity about the relationship between food and energy (page 5 of PDF), learners conduct an experiment to compare how much energy is released as heat from two different foods.
Gummy Growth
Source Institutions
In this activity related to Archimedes' Principle, learners use water displacement to compare the volume of an expanded gummy bear with a gummy bear in its original condition.
Energy For Life
Source Institutions
In this activity about the relationship between food and energy (page 1 of PDF), learners observe and quantify the growth of yeast when it is given table sugar as a food source.

What's the Difference between Weather and Climate?
Source Institutions
In this interactive and informative group activity, learners use packages of M&M's to illustrate the difference between weather and climate.
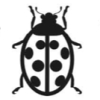
Lengths of Ladybugs
Source Institutions
In this math lesson, learners explore the concept of using units to measure length.
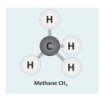
Let's Make Molecules
Source Institutions
In this activity, learners use gumdrops and toothpicks to model the composition and molecular structure of three greenhouse gases: carbon dioxide (CO2), water vapor (H2O) and methane (CH4).
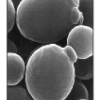
Curious Crystals
Source Institutions
Learners carefully look at four known household crystals.

Work Up An Appetite
Source Institutions
In this activity, learners participate in fun movement activities while playing on a giant game board. Use this activity to get learners involved in physical activity.
Of Cabbages and Kings
Source Institutions
This lesson gives full instructions for making cabbage juice indicator, a procedure sheet for learners to record observations as they use the indicator to test materials, and extension activities to d

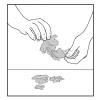
Create a Pasta Population Map
Source Institutions
Learners work as a group to create a map of their community. They use pasta to represent people, and glue the pasta on their maps to show areas of large population.
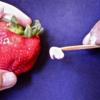
A Simply Fruity DNA Extraction
Source Institutions
In this activity, learners extract DNA from a strawberry and discover that DNA is in the food they eat.
Regolith Formation
Source Institutions
In this three-part activity, learners use food to determine the effects of wind, sandblasting and water on regolith (dust) formation and deposition on Earth.

There's Always Room For JELL-O
Source Institutions
In this activity, learners cut wells in JELL-O© and load the wells with different detergent solutions.
Sugar Crystal Challenge
Source Institutions
This lesson focuses on surface area and how the shape of sugar crystals may differ as they are grown from sugars of different coarseness.
Crushing Test
Source Institutions
In this activity, learners design a crushing test and discover that identifying and controlling the variables may be difficult.
M&M's in Different Sugar Solutions
Source Institutions
In this activity, learners investigate whether having sugar already dissolved in water affects the speed of dissolving and the movement of sugar and color through the water.
Scented Dough
Source Institutions
In this activity, learners follow a recipe to create play dough scented with fruit-flavored drink mix.

Exponential Models: Rhinos and M&M’s ®
Source Institutions
In this math lesson, learners model exponential decay and exponential growth using M&M's, paper folding, and African rhino population data.