Search Results
Showing results 41 to 60 of 76
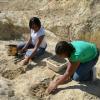
Creating a Soil Map
Source Institutions
In this activity, learners investigate soil conditions by creating a soil map. Learners record soil characteristics and compare the conditions of soil in different grid sections.
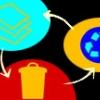
Trash Talkin'
In this activity, learners collect, categorize, weigh and analyze classroom trash and discuss ways that engineers have helped to reduce solid waste.
House Warming
Source Institutions
In this physical sciences activity, learners explore how passive solar design increases energy efficiency.
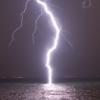
Haunted by Hurricanes: Use Data to Learn About Hurricanes
Source Institutions
In this activity, learners will determine if the frequency and intensity of hurricanes are changing using real data from the National Hurricane Center.
The Return of El Nino
Source Institutions
In this activity related to climate change and data analysis, learners examine temperature and precipitation data to determine if climate variations are due to El Niño.

Floodplain Modeling
In this design-based lesson, learners study flood dynamics as they modify a riverbed with blockages or levees to simulate real-world scenarios.

Geometry and Spatial Relations: Tessellations WOW!
Source Institutions
In this math lesson, learners explore tessellations through literature, music, writing, and art activities.
Conductivity: Salty Water
Source Institutions
Water, whether fresh or salty, serves as one of the best electrical conductors on the planet. Does salt effect its conductivity?

Earth Atmosphere Composition
Source Institutions
In this activity, learners use rice grains to model the composition of the atmosphere of the Earth today and in 1880. Learners assemble the model while measuring percentages.
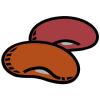
Not Just A Bag Of Beans
Source Institutions
In this activity, learners count and measure kidney beans to explore natural selection and variation. Learners measure the length of 50-100 beans.
Cool Tool
Source Institutions
In this activity (on pages 10-17), learners discover how scientists study biodiversity and the health of the environment based on inspection of small areas—a process known as sampling.
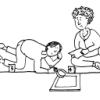
Shoebox Dinosaur Dig Site
Source Institutions
In this activity, (on page 6 of the PDF under SciGirls Activity: Dinosaurs) learners participate in a hands-on fossil excavation.
The Blue Crab's Chesapeake Journey
Source Institutions
In this data collection activity about crabs, learners use data from the Virginia Institute of Marine Science (VIMS) trawl survey to determine the areas of the Chesapeake Bay that are being used by bl
Tsunami: Waves of Destruction
Source Institutions
In this activity, learners use tsunami time travel maps to predict how long it will take a tsunami to reach the shore.
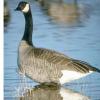
Canada Goose: Explore Trends With Data
Source Institutions
In this activity, learners will explore trends in Canada goose populations using real data from the National Audubon Society's Christmas Bird Count.
BioBlitz
Source Institutions
In this activity (on page 2 of the PDF under GPS: Biodiversity Activity), learners will pair up and take a notebook outdoors to a selected location to observe and record a list of living things that t
Survival of the Fittest: Battling Beetles
Source Institutions
This guided inquiry three-part activity engages learners in thinking about the mechanism of natural selection through data collection and pattern recognition.
Water Walk
Source Institutions
Learners take a field trip along a local body of water and conduct a visual survey to discover information about local land use and water quality.
Harmful Algal Blooms: In Full Bloom
Source Institutions
In this activity, learners will investigate the impacts of harmful phytoplankton using NOAA's Coastal Services Center Harmful Algal Bloom Forecasting (HABF) Project data.
Malformed Frogs
Source Institutions
This activity (on page 2 of the PDF under SciGirls Activity: Malformed Frogs) is a full inquiry investigation into using indicator species to assess the health of an environment.