Search Results
Showing results 1 to 20 of 25
Bean Bugs
Source Institutions
In this outdoor biology and math activity, learners estimate the size of a population of organisms too numerous to count.
Let's Count Humpback Whales: Environmental Effects on Population
Source Institutions
In this activity, learners use whale count data from the Hawaiian Islands Humpback Whale National Marine Sanctuary to compare whale counts in relation to environmental factors.
Coastal Erosion: Where's the Beach?
Source Institutions
Learners use beach profile data from a local beach or online data from Ocean City, Maryland to investigate coastal erosion and sediment transport.
Catch & Release II: It's Catching On!
Source Institutions
Throw that fish back? A new generation of ethical anglers concerned about conserving resources is participating in "catch and release" fishing. How is this going?
Starburst® Graph
Source Institutions
In this activity, learners use Starburst® candy to sort, classify, compare, and graph. Learners grab a handful of one-inch candy squares, sort them by color, graph the candy, and discuss the results.

Jump Like a Frog
Source Institutions
In this math activity, learners jump and measure how far they can jump on different surfaces using different jumping techniques.
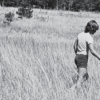
Animals in a Grassland
Source Institutions
In this outdoor, warm weather activity, learners use sweepnets to search a grassy area such as a large lawn or field, collecting small animals to find as many different kinds of animals as possible.
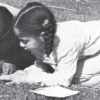
How Many In a Minute
Source Institutions
In this activity, learners will keep track of how much they can do in one minute. Instructors can pick something everyone will do for a minute, such as jumping up and down or drawing stars.
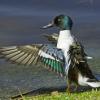
For the Birds: Environmental Effects on Population
Source Institutions
In this activity, learners will investigate how shorebirds and seabirds are extremely vulnerable to changes in their environment, whether human-induced or otherwise.
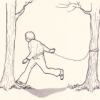
Tree Tally
Source Institutions
In this outdoor activity and fun race, learners first find the most common type of tree in a forest site.
Patterns in Pixels
Source Institutions
This activity (page 2) draws upon a familiar, computer-based concept related to visual resolution: pixilation.
Balance Challenge
Source Institutions
In this quick activity, learners take a balance challenge to measure their average balance time. As they collect data, they investigate how practice and repetition improve their balance time.
Generating and Recording Data
Source Institutions
In this math activity, learners use a "function machine" to collect and organize simple data. The function machine in this case is a cardboard box and the input/output data are paper fish.
Traveling Seeds
Source Institutions
In this activity, learners make three different "seed" types and determine which design flies the farthest.

Create a Pasta Population Map
Source Institutions
Learners work as a group to create a map of their community. They use pasta to represent people, and glue the pasta on their maps to show areas of large population.
Canada Goose: Explore Trends With Data
Source Institutions
In this activity, learners will explore trends in Canada goose populations using real data from the National Audubon Society's Christmas Bird Count.
Harmful Algal Blooms: In Full Bloom
Source Institutions
In this activity, learners will investigate the impacts of harmful phytoplankton using NOAA's Coastal Services Center Harmful Algal Bloom Forecasting (HABF) Project data.

Tree-mendous Plots
Source Institutions
In this math lesson, learners record and graph plant growth and interpret data. Learners plant seeds, and once the seeds sprout, record the change in height of the plants for several days.
Exercise in Creating Drawings for Field Notebooks
Source Institutions
Learners draw and describe a leaf, and then re-find leaves drawn and described by other learners. Learners can observe leaves outside, or leaves may be brought into the classroom.

Energy Use in the Americas
Source Institutions
Learners explore the relationship between energy consumption, population, and carbon emissions in the countries of the Americas.