Search Results
Showing results 1 to 15 of 15
Bean Bugs
Source Institutions
In this outdoor biology and math activity, learners estimate the size of a population of organisms too numerous to count.
Quick Questions: Create a Survey
Source Institutions
In this activity, learners will conduct an open-ended survey, and then organize and analyze results. What languages does everyone speak? What’s the most common? the least common?
Growing Plants: Track Their Growth
Source Institutions
In this activity, learners will be working with predictions with a time frame of one week, or longer. Start by planting seedlings.

Jump Like a Frog
Source Institutions
In this math activity, learners jump and measure how far they can jump on different surfaces using different jumping techniques.

Tree-mendous Plots
Source Institutions
In this math lesson, learners record and graph plant growth and interpret data. Learners plant seeds, and once the seeds sprout, record the change in height of the plants for several days.

Create a Pasta Population Map
Source Institutions
Learners work as a group to create a map of their community. They use pasta to represent people, and glue the pasta on their maps to show areas of large population.
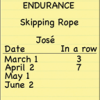
Endurance: How Many Can You Do in a Row?
Source Institutions
Combine math and exercise with this activity. Learners count how many times in a row they can skip rope or throw and catch a ball.
Piles of Paper: Estimate Paper Use
Source Institutions
In this activity, learners keep track of how much paper the group uses in a week. Build awareness of paper waste, while strengthening measurement and estimation skills.
Statistics: Whirlybirds
Source Institutions
In this math lesson, learners measure, predict and determine the frequency of an event as it relates to how close Whirlybirds land to a target.
Quick Questions: Learn About Data
Source Institutions
In this activity, learners will collect and analyze data to learn about the people around them. How many letters in everyone’s first name? What’s the most common number of letters?
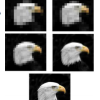
Patterns in Pixels
Source Institutions
This activity (page 2) draws upon a familiar, computer-based concept related to visual resolution: pixilation.
Let's Count Humpback Whales: Environmental Effects on Population
Source Institutions
In this activity, learners use whale count data from the Hawaiian Islands Humpback Whale National Marine Sanctuary to compare whale counts in relation to environmental factors.
Fruity-Glows: Pictures of Health on a Microarray Canvas
Source Institutions
In this activity (page 12), learners apply the concepts of pixilation and pointillism to the world of biomedical science.
Starburst® Graph
Source Institutions
In this activity, learners use Starburst® candy to sort, classify, compare, and graph. Learners grab a handful of one-inch candy squares, sort them by color, graph the candy, and discuss the results.
Paper Bag Skits: Using Size and Measurement
Source Institutions
Put the math of measurement, numbers, and everyday life into improvisational skits.