Search Results
Showing results 1 to 18 of 18

Soccer
Source Institutions
In this math activity (Page 12 of the Play Ball! PDF), learners play a game of "soccer" and analyze the results of the game.
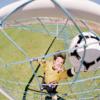
Ball Bounce Experiment
Source Institutions
In this activity, learners investigate the properties of different types of balls.

Basketball
Source Institutions
In this math activity (Page 14 of the Play Ball! PDF), learners play a game of "basketball" and analyze the results of the game.
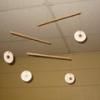
Rotational Equilibrium
Source Institutions
In this activity, learners explore the concept of rotational equilibrium. Learners work in teams to estimate and determine the force within a mobile design.
Tree-mendous Plots
Source Institutions
In this math lesson, learners record and graph plant growth and interpret data. Learners plant seeds, and once the seeds sprout, record the change in height of the plants for several days.
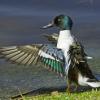
For the Birds: Environmental Effects on Population
Source Institutions
In this activity, learners will investigate how shorebirds and seabirds are extremely vulnerable to changes in their environment, whether human-induced or otherwise.

Football
Source Institutions
In this math activity (Page 10 of the Play Ball! PDF), learners play a game of "football" and analyze the results of the game.
Heat Capacity: Can't Take the Heat?
Source Institutions
Why is ocean water sometimes the warmest when the average daily air temperature starts to drop? In this activity, learners explore the differing heat capacities of water and air using real data.
Otter Smorgasbord
Source Institutions
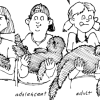
In this graphing activity (on pages 33-40), learners investigate how much and what kinds of food sea otter pups eat during their first year of life.
Baseball
Source Institutions
In this math activity (Page 17 of the Play Ball! PDF), learners play a game of "baseball" and analyze the results of the game.
Let's Count Humpback Whales: Environmental Effects on Population
Source Institutions
In this activity, learners use whale count data from the Hawaiian Islands Humpback Whale National Marine Sanctuary to compare whale counts in relation to environmental factors.
Coastal Erosion: Where's the Beach?
Source Institutions
Learners use beach profile data from a local beach or online data from Ocean City, Maryland to investigate coastal erosion and sediment transport.
Eatem Up
Source Institutions
In this math activity, learners use gingerbread cookies to collect and organize simple data. First, learners read "The Gingerbread Boy" by Paul Galdone.
Whose Fault Is It?
Source Institutions
In this seismic simulation, learners play a "who-dunnit" game to explore earthquakes.
Cardiac Hill
Source Institutions
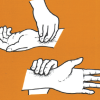
In this outdoor activity linking human health to the environment, learners use their pulse rates as a measure of the effort expended in walking on different slopes.
Catch & Release II: It's Catching On!
Source Institutions
Throw that fish back? A new generation of ethical anglers concerned about conserving resources is participating in "catch and release" fishing. How is this going?

Active Graphs
Source Institutions
In this activity, learners track their movements with jumping and leaping graphs.

