Search Results
Showing results 1 to 19 of 19
Public Key Encryption: Kid Krypto
Source Institutions
In this activity, learners conduct a simulation exercise related to public key encryption and try to intercept a message sent between two learners.
The Poor Cartographer: Graph Coloring
Source Institutions
In this activity, learners help a poor cartographer color in the countries on a map, making sure each country is colored a different color than any of its neighbors.
Treasure Hunters
Source Institutions
Learners use their opponent's clues and a compass rose to find the hidden treasure on a map. Learners use problem solving and coordinate grid skills as they hunt for treasure.
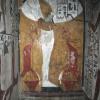
Tomb Mapping
Source Institutions
In this activity, learners examine the culture and history of the tomb site.

The Daily Ups and Downs
Source Institutions
In this activity, learners graph 48 hourly air temperatures from a local weather observation site and observe the diurnal temperature variations.
Creating a Soil Map
Source Institutions
In this activity, learners investigate soil conditions by creating a soil map. Learners record soil characteristics and compare the conditions of soil in different grid sections.
Mapping the Classroom
Source Institutions
In this activity, learners discover the importance of maps and scale as they work together to create a map of the classroom.
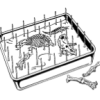
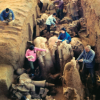
Classroom Dinosaur Dig
Source Institutions
In this activity, learners participate in a simulated dig to discover fossilized dinosaur bones. Learners take notes, make a map and propose theories about dinosaurs.

Create a Pasta Population Map
Source Institutions
Learners work as a group to create a map of their community. They use pasta to represent people, and glue the pasta on their maps to show areas of large population.
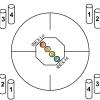
Particle Detection
Source Institutions
By tossing, collecting, and sorting beanbags, learners understand how the IBEX spacecraft uses its sensors to detect and map the locations of particle types in the interstellar boundary.
Map That Habitat
Source Institutions
Historically, sea floor mapping (bathymetry) was done by soundings.
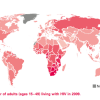
Mapping the Spread of HIV/AIDS: Trailing the Pandemic
Source Institutions
In this activity, learners act as epidemiologists by mapping the prevalence of HIV/AIDS worldwide.

Drawing Conclusions
Source Institutions
In this weather forecasting activity, learners determine the location of cold and warm fronts on weather plot maps.

Forward Thinking
Source Institutions
In this activity, learners create their own weather forecast map.

Energy Use in the Americas
Source Institutions
Learners explore the relationship between energy consumption, population, and carbon emissions in the countries of the Americas.

If Anyone Can, Icon
Source Institutions
In this activity, learners create their own icons for a forecast-at-a-glance poster for their classroom/learning space.
Where on Earth?
Source Institutions
Learners look at labels on items in the room to determine where each item was manufactured, then write about the item on an index card.
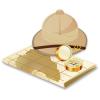
Where in the World is the Terra Cotta Army?
Source Institutions
In this activity, learners find Xi'an, the archaeological area in China where the Terra Cotta Army was discovered, on a map or globe and look more closely at the relationship of the warrior site to ot
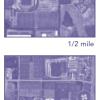
Aerial Imagery
Source Institutions
This activity (on page 2 of the PDF under SciGirls Activity: Earthquakes) is a full inquiry investigation into aerial imagery.