Search Results
Showing results 21 to 40 of 40
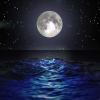
Modeling Tidal Action
Source Institutions
In this activity (Lesson 1), learners work in groups to create tide simulations.
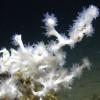
Mountains in the Sea
Source Institutions
In this 6-7 day investigation, learners begin with an introduction to seamounts that are present in the Gulf of Alaska.
The Carbon Cycle Game
Source Institutions
In this activity, learners take on the role of a carbon atom and record which reservoirs in the carbon cycle they visit.
What is in the Water?
Source Institutions
In this activity, learners use open inquiry to learn about the process of science as well as gain experience regarding the Law of Conservation of Mass, dissolution, and density.
The Return of El Nino
Source Institutions
In this activity related to climate change and data analysis, learners examine temperature and precipitation data to determine if climate variations are due to El Niño.

That Sinking Feeling
Source Institutions
In this quick activity, learners observe how salinity and temperature affect the density of water, to better understand the Great Ocean Conveyor.

Conductivity: Salty Water
Source Institutions
Water, whether fresh or salty, serves as one of the best electrical conductors on the planet. Does salt effect its conductivity?
Buoyancy Bulls-Eye
Source Institutions
In this hands-on activity, learners will construct a scuba diver that can float in order to explore how sea creatures stay neutrally buoyant in the ocean and to see what kinds of forces might be influ
The Ins and Outs of Tides: Learn About Causes and Predictions
Source Institutions
In this activity, learners will compare predicted and observed tides using data from The National Oceanic and Atmospheric Administration(NOAA).
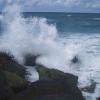
Tsunami: Waves of Destruction
Source Institutions
In this activity, learners use tsunami time travel maps to predict how long it will take a tsunami to reach the shore.
Map That Habitat
Source Institutions
Historically, sea floor mapping (bathymetry) was done by soundings.
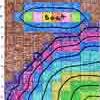
Harmful Algal Blooms: In Full Bloom
Source Institutions
In this activity, learners will investigate the impacts of harmful phytoplankton using NOAA's Coastal Services Center Harmful Algal Bloom Forecasting (HABF) Project data.
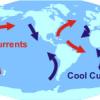
How it is Currently Done
Source Institutions
In this quick activity, learners observe how wind creates ocean currents.

Corals on Acid
Source Institutions
The objective of this inquiry-based lesson is for learners to gain an understanding of how increasing ocean acidity can affect the calcification of marine organisms.
Whale Cart
Source Institutions
In this activity, learners interact with whale artifacts such as replicas of skulls, bones, teeth, and baleen (hair-like plates that form a feeding filter).

What-a-cycle
Source Institutions
In this activity, learners act as water molecules and travel through parts of the water cycle to discover that it is more complex than just water moving from the ground to the atmosphere.
Off Base
Source Institutions
In this activity, learners explore the factors that tend to resist changes in pH of the ocean and why the ocean is becoming more acidic.

Heat Capacity: Can't Take the Heat?
Source Institutions
Why is ocean water sometimes the warmest when the average daily air temperature starts to drop? In this activity, learners explore the differing heat capacities of water and air using real data.
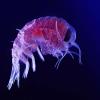
Amphipods: More than Mud
Source Institutions
In this data analysis and environmental science activity, learners examine the effects of pollution on amphipods using data from the Chesapeake Ecotox Research Program.

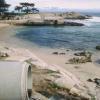
A Hurricane's Storm Surge Affects our Estuaries
Source Institutions
In this activity, learners construct a coastal landmass from sand and add features such as tidal creeks and barrier islands.