Search Results
Showing results 41 to 56 of 56

Terrestrial Hi-Lo Hunt
Source Institutions
In this outdoor activity, learners search for the warmest and coolest, windiest and calmest, wettest and driest, and brightest and darkest spots in an area.
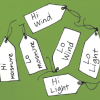
Sensory Hi-Lo Hunt
Source Institutions
In this outdoor activity, learners use only their senses to to find the extremes of several environmental variables or physical factors: wind, temperature, light, slope and moisture.

Drawing Conclusions
Source Institutions
In this weather forecasting activity, learners determine the location of cold and warm fronts on weather plot maps.

Forward Thinking
Source Institutions
In this activity, learners create their own weather forecast map.

If Anyone Can, Icon
Source Institutions
In this activity, learners create their own icons for a forecast-at-a-glance poster for their classroom/learning space.
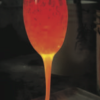
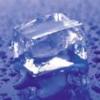
Hot Stuff!
Source Institutions
In this activity, learners discover that sand is the major ingredient in glass.
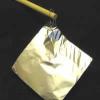
Weather Stations: Winds
Source Institutions
In this activity, learners use a toaster to generate wind and compare the appliance's heat source to Jupiter's own hot interior. Learners discover that convection drives wind on Jupiter and on Earth.

The Ups and Downs of Thermometers
Source Institutions
In this activity, learners examine the parts of a thermometer. After placing a thermometer in hot and cold water, learners look at molecular model animations of the liquid in a thermometer.

Changing the Density of a Liquid: Heating and Cooling
Source Institutions
Learners investigate how the temperature of water affects its density.
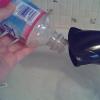
Air Pressure
Source Institutions
In this experiment, learners use a blow dryer and water bottle to observe and record changes in air pressure caused by changes in temperature.

Heat Capacity: Can't Take the Heat?
Source Institutions
Why is ocean water sometimes the warmest when the average daily air temperature starts to drop? In this activity, learners explore the differing heat capacities of water and air using real data.

What is a "Model"?
Source Institutions
In this activity, learners simulate the behavior of the atmosphere.
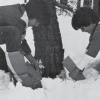
Wintergreen
Source Institutions
In this outdoor, winter activity, learners find living green plants under the snow and determine the light and temperature conditions around the plants.

Discovering Rainforest Locations
Source Institutions
In this activity, learners will examine various world data maps to combine the information and predict which areas could be tropical rainforests.
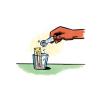
Change in Temperature: Exothermic Reaction
Source Institutions
Learners add calcium chloride to a baking soda solution and observe an increase in temperature along with the production of a gas and a white precipitate. These are all signs of a chemical reaction.
Keep it Cool
Source Institutions
In this activity, learners explore how engineers have met the challenge of keeping foods, liquids, and other items cool.