Search Results
Showing results 1 to 20 of 28
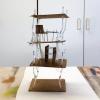
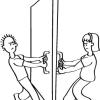
Engineering For Earthquakes
Source Institutions
In this design challenge, learners will engineer a structure and see if it can survive an earthquake they create.
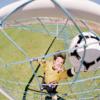
Ball Bounce Experiment
Source Institutions
In this activity, learners investigate the properties of different types of balls.
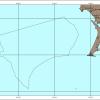
West Coast Shipwrecks
Source Institutions
In this data activity, learners will explore shipwrecks from four National Marine Sanctuaries on the West Coast of the United States.

Building Bingo
Source Institutions
In this on site "field trip" activity (located on pages 6-9 of PDF), learners get hands-on experience identifying building materials by playing "Building Bingo".
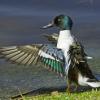
For the Birds: Environmental Effects on Population
Source Institutions
In this activity, learners will investigate how shorebirds and seabirds are extremely vulnerable to changes in their environment, whether human-induced or otherwise.
Human Interface Design: The Chocolate Factory
Source Institutions
In this activity about human interface design issues, learners help the Oompa-Loompas of a great chocolate factory solve different problems.
Conductivity: Salty Water
Source Institutions
Water, whether fresh or salty, serves as one of the best electrical conductors on the planet. Does salt effect its conductivity?
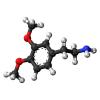
Ionic Bonding Puzzle Lab
Source Institutions
In this activity, learners create models of ionic compounds and observe the chemical formula of binary molecules they have created.
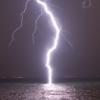
Haunted by Hurricanes: Use Data to Learn About Hurricanes
Source Institutions
In this activity, learners will determine if the frequency and intensity of hurricanes are changing using real data from the National Hurricane Center.
BioBlitz
Source Institutions
In this activity (on page 2 of the PDF under GPS: Biodiversity Activity), learners will pair up and take a notebook outdoors to a selected location to observe and record a list of living things that t
The Return of El Nino
Source Institutions
In this activity related to climate change and data analysis, learners examine temperature and precipitation data to determine if climate variations are due to El Niño.
Biodiversity of Feet
Source Institutions
This activity (on page 3 of the PDF under GPS: Biodiversity Activity) is a full inquiry investigation into biodiversity.
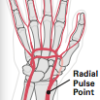
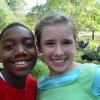
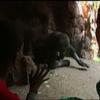
Heart Rate and Exercise
Source Institutions
In this activity about heart health (on page 27 of the PDF), learners measure their heart rates after a variety of physical activities and compare the results with their resting heart rates, and with
Tsunami: Waves of Destruction
Source Institutions
In this activity, learners use tsunami time travel maps to predict how long it will take a tsunami to reach the shore.
Fish Eyes: More than Meets the Eye
Source Institutions
In this data collection and analysis activity, learners evaluate fish physiology and ecology using vision research data from Dr.

Nutritional Challenges
Source Institutions
In this nutrition activity (page 26 of PDF), learners consider the nutritional needs of people with specific dietary requirements, such as athletes, persons with diabetes and vegetarians, and create a
Hand Biometrics Technology
Source Institutions
In this activity, learners explore how engineers incorporate biometric technologies into products as well as the challenges of engineers who must weigh privacy, security and other issues when designin

The Dead Zone: A Marine Horror Story
Source Institutions
In this environmental science and data analysis activity, learners work in groups to track a Dead Zone (decreased dissolved oxygen content of a body of water) using water quality data from the Nutrien
Let's Count Humpback Whales: Environmental Effects on Population
Source Institutions
In this activity, learners use whale count data from the Hawaiian Islands Humpback Whale National Marine Sanctuary to compare whale counts in relation to environmental factors.
Mapping Mockingbirds
Source Institutions
This lesson plan revolves around studying the speciation of the Galápagos mockingbirds, which are on display at the California Academy of Sciences.