Search Results
Showing results 1 to 19 of 19
The Geophysical Light/Dark Cycle
Source Institutions
This is an activity (located on page 131 of the PDF) related to sleep and circadian rhythms as well as space travel.

A Cubic Foot Per Second
Source Institutions
In this activity, learners measure and calculate the amount of cubic feet various containers contain. Next, learners investigate cubic feet per second (cps), by carrying jugs in one second.

Arctic Sea Ice
Source Institutions
In this activity, learners explore how the area of Arctic sea ice has changed over recent years. First, learners graph the area of Arctic sea ice over time from 1979 to 2007.
Relative Speed of Dinosaurs
Source Institutions
In this activity, learners interpret three trackways and use measurements and a formula to infer the relative speed of dinosaurs.

Mapping Greenhouse Gas Emissions Where You Live
Source Institutions
In this lesson plan, learners examine some of the of greenhouse gas emissions sources in their community.
Aesop's Arithmetic
Source Institutions
In this activity (located on page 9 of the PDF), learners are introduced to Aesop's fable, "The Crow and the Pitcher." In the story, a clever crow drops pebbles into a pitcher to cause the water level
The Parachuting Egg
Source Institutions
In this activity, learners work in groups to design a parachute out of household items that keeps an egg secure when dropped from a certain height.

Coral Snapshots: Biodiversity in Marine Protected Areas
Source Institutions
In this data activity, learners analyze data from coral reef snapshots taken by scientists at the Virginia Institute of Marine Science.
Shower Estimation
Source Institutions
In this activity, learners calculate their water usage (in cups and galloons) during an average shower. Learners also chart and analyze water usage during showers in their households.
Counting Your Lucky Stars
Source Institutions
In this activity, learners sample a star field to estimate the number of stars in the universe.
Diatom Ooze: Ooze Clues
Source Institutions
In this activity, learners will plot the distribution of various oozes using information from sediment maps.
Any Year Calendars
Source Institutions
This PDF contains 12 calendars (12 months). Each month contains activities about math. Things to do on familiar holidays (like July 4), less common holidays (like Backward Day), and any day.
The Ins and Outs of Tides: Learn About Causes and Predictions
Source Institutions
In this activity, learners will compare predicted and observed tides using data from The National Oceanic and Atmospheric Administration(NOAA).
Planet Surfing
Source Institutions
In this astronomy activity (page 6 of the PDF), learners will compare and contrast two planets in the solar system using data obtained from the internet.

Drawing Conclusions
Source Institutions
In this weather forecasting activity, learners determine the location of cold and warm fronts on weather plot maps.
Mass of the Earth
Source Institutions
In this activity, learners use basic measurements of the Earth and pieces of rock and iron to estimate the mass of the Earth.
Sharks: Taking a Bite Out of The Myth
Source Institutions
In this activity, learners will explore trends in shark populations using shark landing data from the National Marine Fisheries Service.
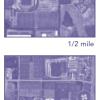
Aerial Imagery
Source Institutions
This activity (on page 2 of the PDF under SciGirls Activity: Earthquakes) is a full inquiry investigation into aerial imagery.

Sustainable Grazing
Source Institutions
In this activity, learners investigate the food, water, and space needs of common livestock animals.