Search Results
Showing results 21 to 40 of 52
Any Year Calendars
Source Institutions
This PDF contains 12 calendars (12 months). Each month contains activities about math. Things to do on familiar holidays (like July 4), less common holidays (like Backward Day), and any day.
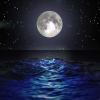
The Ins and Outs of Tides: Learn About Causes and Predictions
Source Institutions
In this activity, learners will compare predicted and observed tides using data from The National Oceanic and Atmospheric Administration(NOAA).

Mapping Greenhouse Gas Emissions Where You Live
Source Institutions
In this lesson plan, learners examine some of the of greenhouse gas emissions sources in their community.
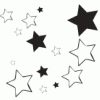
Counting Your Lucky Stars
Source Institutions
In this activity, learners sample a star field to estimate the number of stars in the universe.
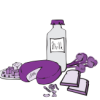
Servings and Choices
Source Institutions
In this nutrition activity (page 16 of PDF), learners document their individual eating habits and learn whether their eating patterns meet their needs.
Your Energy Needs
Source Institutions
In this activity about the relationship between food and energy (page 8 of PDF), learners estimate average daily baseline energy (Calorie) needs and energy needs for different levels of activity.
Building Blocks
Source Institutions
In this activity (page 32 of PDF), learners investigate the nutritional needs of healthy bones and muscles.
The Search for Secret Agents
Learners tour their school or home looking for sources of indoor air pollutants (IAPs).
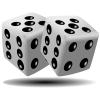
Probability: Remove One
Source Institutions
In this math lesson, learners are given 15 chips and a number line labeled from 2-12.
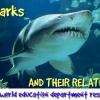
Sharks: Taking a Bite Out of The Myth
Source Institutions
In this activity, learners will explore trends in shark populations using shark landing data from the National Marine Fisheries Service.
The Carbon Cycle and its Role in Climate Change: Activity 2
Source Institutions
In this activity (on page 7), learners explore the meaning of a "carbon sink." Using simple props, learners and/or an educator demonstrate how plants act as carbon sinks and how greenhouse gases cause
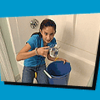
Shower Estimation
Source Institutions
In this activity, learners calculate their water usage (in cups and galloons) during an average shower. Learners also chart and analyze water usage during showers in their households.

Fill it to Capacity
Source Institutions
In this math lesson, learners rotate through six estimating and measuring centers. First, learners read the book, "Room for Ripley" by Stuart J.
Go Bug!
Source Institutions
By playing a card game similar to "Go Fish," but based on the stages of metamorphosis, learners will be able to see how insects change in form as they grow and will consider the advantages of undergoi
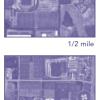
Aerial Imagery
Source Institutions
This activity (on page 2 of the PDF under SciGirls Activity: Earthquakes) is a full inquiry investigation into aerial imagery.
The Parachuting Egg
Source Institutions
In this activity, learners work in groups to design a parachute out of household items that keeps an egg secure when dropped from a certain height.

Coral Snapshots: Biodiversity in Marine Protected Areas
Source Institutions
In this data activity, learners analyze data from coral reef snapshots taken by scientists at the Virginia Institute of Marine Science.
Multitasking Mania
Source Institutions
In this activity, learners conduct scientific research on multitasking. Learners determine if multitasking with media while doing homework affects their ability to successfully complete the homework.
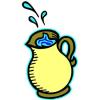
Aesop's Arithmetic
Source Institutions
In this activity (located on page 9 of the PDF), learners are introduced to Aesop's fable, "The Crow and the Pitcher." In the story, a clever crow drops pebbles into a pitcher to cause the water level
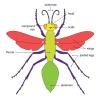
Invent an Insect
Source Institutions
In this creative activity, learners will find out what makes an insect an insect by studying examples of insect adaptations and by examining why there are so many different types of insects.