Search Results
Showing results 41 to 60 of 63
How Greenhouse Gases Absorb Heat
Source Institutions
Learners observe two model atmospheres -- one with normal atmospheric composition and another with an elevated concentration of carbon dioxide.
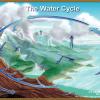
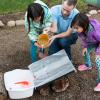
The Incredible Journey
Source Institutions
In this weather activity (page 4 of the PDF), learners will explore the water cycle through an interactive game.
Atmosphere Composition Model
Source Institutions
In this activity, learners create a model using metric measuring tapes and atmosphere composition data.
Catch the Wind
Source Institutions
In this weather activity (page 1 of the PDF), learners will construct their very own anemometer to measure wind speed.

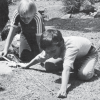
Terrestrial Hi-Lo Hunt
Source Institutions
In this outdoor activity, learners search for the warmest and coolest, windiest and calmest, wettest and driest, and brightest and darkest spots in an area.
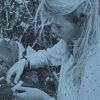
Trees: Recorders of Climate Change
Source Institutions
In this activity, learners are introduced to tree rings by examining a cross section of a tree, also known as a “tree cookie.” They discover how tree age can be determined by studying the rings and ho

Drawing Conclusions
Source Institutions
In this weather forecasting activity, learners determine the location of cold and warm fronts on weather plot maps.
Moisture Makers
Source Institutions
In this outdoor activity, learners compare the moisture released from different kinds of leaves and from different parts of the same leaf, by observing the color change of cobalt chloride paper.
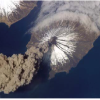
Earth and Mars
Source Institutions
Based on color photographic images, learners compare geological features on Earth and Mars to understand similarities and differences between the two planets, and consider the forces that created land
Ice on Mars
Source Institutions
In this activity, learners use sand and ice cubes to create a model of permafrost and the effects of the ice melting through the surface.

Battling for Oxygen
Working in groups, learners model the continuous destruction and creation of ozone (O3) molecules, which occur in the ozone layer.
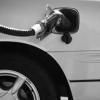
Automotive Emissions and the Greenhouse Effect
Source Institutions
In this activity about global climate change, learners will conduct an experiment and collect data to compare the amount of carbon dioxide (CO2) in four different sources of gases.
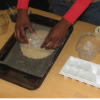
Runaway Runoff
Source Institutions
When it rains, water can collect on top of and seep into the ground. Water can also run downhill, carrying soil and pollution with it.
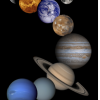
Habitable Worlds
Source Institutions
In this group activity, learners consider environmental conditions—temperature, presence of water, atmosphere, sunlight, and chemical composition—on planets and moons in our solar system to determine
Cool It
Source Institutions
In this outdoor activity/game, learners use thermometers to simulate how lizards survive in habitats with extreme temperatures.
I Can't Take the Pressure!
Learners develop an understanding of air pressure in two different activities.

Heat Capacity: Can't Take the Heat?
Source Institutions
Why is ocean water sometimes the warmest when the average daily air temperature starts to drop? In this activity, learners explore the differing heat capacities of water and air using real data.
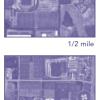
Aerial Imagery
Source Institutions
This activity (on page 2 of the PDF under SciGirls Activity: Earthquakes) is a full inquiry investigation into aerial imagery.

Discovering Rainforest Locations
Source Institutions
In this activity, learners will examine various world data maps to combine the information and predict which areas could be tropical rainforests.
The Crayon Rock Cycle
Source Institutions
In this activity, learners use crayons to draw conclusions about rocks and the rock cycle.