Search Results
Showing results 61 to 80 of 317
Number Sense and Computation: An Apple a Day
Source Institutions
In this math lesson, learners make estimates to analyze the number of apples per acre, and visualize the magnitude of one million.
Throwing Pi
Source Institutions
In this calculus activity, learners use a classic problem of geometrical probability to find an important mathematical constant (pi).
Shape & Solid Exploration
Source Institutions
In this game, learners use clues to identify mystery shapes. Use everyday objects (like from the pantry) as the shapes.
Jump Like a Frog
Source Institutions
In this math activity, learners jump and measure how far they can jump on different surfaces using different jumping techniques.
Understanding Albedo
Source Institutions
In this activity related to climate change, learners examine albedo and the ice albedo feedback effect as it relates to snow, ice, and the likely results of reduced snow and ice cover on global temper

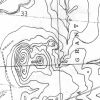
Mapping Sea Level Rise
Source Institutions
In this activity related to climate change, learners create and explore topographical maps as a means of studying sea level rise.
My Angle on Cooling: Effects of Distance and Inclination
Source Institutions
In this activity, learners discover that one way to cool an object in the presence of a heat source is to increase the distance from it or change the angle at which it is faced.
Joe's Place
Source Institutions
In this math activity (Page 8 of the Dining Out! PDF), younger learners select items from a menu and count out the total amount needed using the fewest bills and coins possible.
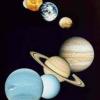
The Thousand-Yard Model
Source Institutions
This is a classic exercise for visualizing the scale of the Solar System.
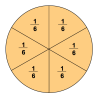
Number Sense and Computation: To Half or Half Not
Source Institutions
In this math lesson, learners use slices of bread and geoboards to explore several ways to divide a rectangle in half. Learners also identify equivalent fractions that represent one-half.

Tree-mendous Plots
Source Institutions
In this math lesson, learners record and graph plant growth and interpret data. Learners plant seeds, and once the seeds sprout, record the change in height of the plants for several days.
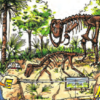
Dinosaur Interaction
Source Institutions
In this activity, learners explore why animals, specifically dinosaurs, live in families.
Blazing the Trail
Source Institutions
In this math lesson, learners estimate distances between landmarks and use a map and scales to determine the actual distances.
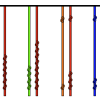
Quipus
Source Institutions
Learners create an Incan counting device called a quipu (pronounced kee-poo).
Solar System in My Neighborhood
Source Institutions
In this activity, learners shrink the scale of the vast solar system to the size of their neighborhood.
Our Sense of Sight: How We Perceive Movement, Depth and Illusions
Source Institutions
In this activity, learners investigate visual perception as well as plan and conduct their own experiments.
No bones about it!
Source Institutions
This is an activity (located on page 3 of the PDF) about the mixture of materials in bone and how they affect its strength.
Human Interface Design: The Chocolate Factory
Source Institutions
In this activity about human interface design issues, learners help the Oompa-Loompas of a great chocolate factory solve different problems.
Smaller Than You Think
Source Institutions
Learners compare a life-size drawing of a Tyrannosaurus rex head and a full-size Sinornithosaurus body to understand that dinosaurs varied in size.
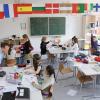
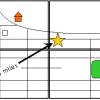
Mapping the Classroom
Source Institutions
In this activity, learners discover the importance of maps and scale as they work together to create a map of the classroom.