Search Results
Showing results 1 to 17 of 17

Create a Pasta Population Map
Source Institutions
Learners work as a group to create a map of their community. They use pasta to represent people, and glue the pasta on their maps to show areas of large population.
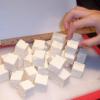
Gumdrop Dome
Source Institutions
In this activity (located on pages 23-24 of the PDF), learners are introduced to structural engineering and encouraged to practice goal-oriented building.
Smell Match
Source Institutions
In this matching activity (3rd activity on the page), learners use their sense of smell to match pairs of opaque containers filled with various smelly items like orange peel, roses, or moth balls.
Measuring Rules
Source Institutions
In this math activity, learners create their own units of measurement by making noodle rulers. Learners practice estimating and measuring objects using the noodle rulers .
The Right Fit
Source Institutions
In this math activity, learners trace their hands and estimate the number of beans that can fit into their hand tracings. Then, learners glue the beans to the tracing to test out their estimations.
How Sweet It Is
Source Institutions
In this activity (4th activity on the page), learners use their sense of smell to rate and arrange containers filled with different dilutions of a scent (like cologne or fruit juice) in order from wea

Bake Sale
Source Institutions
This activity helps learners learn about math through a real-world scenario. Three friends are baking cookies for their school’s bake sale.
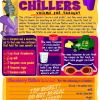
Chocoberry Chillers: Volume for Thought
Source Institutions
In this Cyberchase activity, have fun measuring volumes and enjoy a delicious shake.

Exponential Models: Rhinos and M&M’s ®
Source Institutions
In this math lesson, learners model exponential decay and exponential growth using M&M's, paper folding, and African rhino population data.
Build a Super Structure
Source Institutions
In this activity, learners use things from the kitchen as building materials to explore how shapes contribute to the strength of different structures.
Digit's Cyber-Dough
Source Institutions
In this fun hands-on activity, learners whip up a batch of cyber-dough (play dough) using math for measurements.
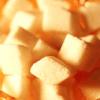
Sugar Crystal Challenge
Source Institutions
This lesson focuses on surface area and how the shape of sugar crystals may differ as they are grown from sugars of different coarseness.

The Scoop on Scallops
Source Institutions
In this data analysis activity, learners quantify the abundance and distribution of sea scallops in and adjacent to the Mid-Atlantic closed areas.

Chilean Sea Bass: Off the Menu
Source Institutions
In this data analysis activity, learners use data collected by the Commission for the Conservation of Antarctic Marine Living Resources (CCAMLR) to study Chilean sea bass populations.
Exploring at the Nanoscale
Source Institutions
This lesson focuses on how nanotechnology has impacted our society and how engineers have learned to explore the world at the nanoscale.
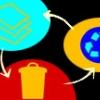
Trash Talkin'
In this activity, learners collect, categorize, weigh and analyze classroom trash and discuss ways that engineers have helped to reduce solid waste.

Mapping Sea Level Rise
Source Institutions
In this activity related to climate change, learners create and explore topographical maps as a means of studying sea level rise.