Search Results
Showing results 1 to 20 of 63
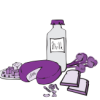
Using Food Labels
Source Institutions
In this nutrition activity, learners explore food labels and consider the nutritional value of foods. Learners also explore units of measurement commonly used on food labels.

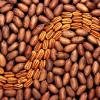
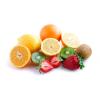
Plant Parts You Eat
Source Institutions
In this food science activity, learners observe different plant-originated foods.
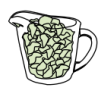
Building Blocks
Source Institutions
In this activity (page 32 of PDF), learners investigate the nutritional needs of healthy bones and muscles.
Energy Sources
Source Institutions
In this activity about the relationship between food and energy (page 5 of PDF), learners conduct an experiment to compare how much energy is released as heat from two different foods.
Serving Sizes
Source Institutions
In this nutrition and estimation activity (page 12 of PDF), learners estimate serving sizes of different foods and compare their estimates to serving size information provided on nutrition food labels
Energy For Life
Source Institutions
In this activity about the relationship between food and energy (page 1 of PDF), learners observe and quantify the growth of yeast when it is given table sugar as a food source.

Tasty Buds
Source Institutions
In this activity (1st activity on the page), learners explore their sense of taste and the structure of the tongue by taste-testing various foods.

Nutritional Challenges
Source Institutions
In this nutrition activity (page 26 of PDF), learners consider the nutritional needs of people with specific dietary requirements, such as athletes, persons with diabetes and vegetarians, and create a

Sustainable Grazing
Source Institutions
In this activity, learners investigate the food, water, and space needs of common livestock animals.
Number Sense and Computation: Food For Thought
Source Institutions
In this math lesson, learners identify and compare unit costs of given items. Learners use computation skills, problem solving and number sense to find the cost of an ounce of cereal.
Servings and Choices
Source Institutions
In this nutrition activity (page 16 of PDF), learners document their individual eating habits and learn whether their eating patterns meet their needs.
Do Plants Need Light?
Source Institutions
In this food science activity, learners conduct an experiment that demonstrates the importance of light to plants.
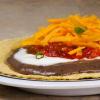
Creating Tostadas
Source Institutions
In this activity, learners develop their understanding of combinations as they create as many different kinds of tostadas as possible.
Your Energy Needs
Source Institutions
In this activity about the relationship between food and energy (page 8 of PDF), learners estimate average daily baseline energy (Calorie) needs and energy needs for different levels of activity.
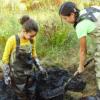
Bury Me Not!
Source Institutions
This activity (page 2 of the PDF under SciGirls Activity: Bogs) is a full inquiry investigation into decomposition.

Create a Pasta Population Map
Source Institutions
Learners work as a group to create a map of their community. They use pasta to represent people, and glue the pasta on their maps to show areas of large population.
Starburst® Graph
Source Institutions
In this activity, learners use Starburst® candy to sort, classify, compare, and graph. Learners grab a handful of one-inch candy squares, sort them by color, graph the candy, and discuss the results.
Pennies for Pits
Source Institutions
In this math lesson, learners use fruit to learn about proportions and percentages. Learners compare the weights of the edible and non-edible portions of fruit.
Breakfast Sweets
Source Institutions
In this math activity, learners guess which cereals contain the most sugar. Learners use the nutrition labels on the cereal boxes to find the cereal with the least amount of sugar.

What's the Difference between Weather and Climate?
Source Institutions
In this interactive and informative group activity, learners use packages of M&M's to illustrate the difference between weather and climate.