Search Results
Showing results 41 to 60 of 62
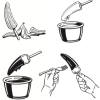
T. rex Cretaceous Treat
Source Institutions
In this activity, learners make edible T. rex teeth (with adult assistance). The treat is a white and dark chocolate covered banana on a stick.
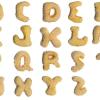
Computation and Estimation: Alphabits
Source Institutions
In this math lesson, learners apply the concepts of ratios and percentages to the distribution of letters contained in a box of Alphabits® cereal.
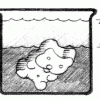
Gummy Growth
Source Institutions
In this activity related to Archimedes' Principle, learners use water displacement to compare the volume of an expanded gummy bear with a gummy bear in its original condition.
Cookie Surface Area
Source Institutions
This is an activity (on page 2 of the PDF under Surface Area Activity) about surface area to volume ratio.
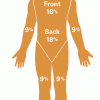
Measuring and Protecting Skin
Source Institutions
In this activity, learners compare and contrast their own skin (including the area covered) with that of an orange.
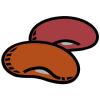
Not Just A Bag Of Beans
Source Institutions
In this activity, learners count and measure kidney beans to explore natural selection and variation. Learners measure the length of 50-100 beans.

Mix It Up
Source Institutions
In this math lesson, learners are introduced to proportional reasoning through modeling, sharing, and questioning techniques.
Digit's Cyber-Dough
Source Institutions
In this fun hands-on activity, learners whip up a batch of cyber-dough (play dough) using math for measurements.
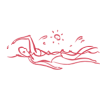
Why Circulate?
Source Institutions
In this activity related to the human circulatory system (on page 10 of the PDF), learners observe the dispersion of a drop of food coloring in water, draw conclusions about the movement of dissolved

The Scoop on Scallops
Source Institutions
In this data analysis activity, learners quantify the abundance and distribution of sea scallops in and adjacent to the Mid-Atlantic closed areas.

A Funny Taste
Source Institutions
In this activity, learners explore the different salinities of various sources of water by taste-testing.
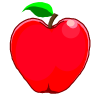
Number Sense and Computation: An Apple a Day
Source Institutions
In this math lesson, learners make estimates to analyze the number of apples per acre, and visualize the magnitude of one million.

Statistics: Something Fishy
Source Institutions
In this math lesson, learners apply the concepts of ratio and proportion to the capture-recapture statistical procedure.

Chilean Sea Bass: Off the Menu
Source Institutions
In this data analysis activity, learners use data collected by the Commission for the Conservation of Antarctic Marine Living Resources (CCAMLR) to study Chilean sea bass populations.
Harmful Algal Blooms: In Full Bloom
Source Institutions
In this activity, learners will investigate the impacts of harmful phytoplankton using NOAA's Coastal Services Center Harmful Algal Bloom Forecasting (HABF) Project data.
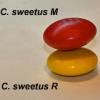
Survival of the Fittest: Variations in the Clam Species Clamys sweetus
Source Institutions
This guided inquiry three-part activity engages learners in thinking about the mechanism of natural selection by encouraging them to formulate questions that can be answered through scientific investi
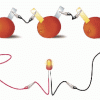
Electricity: Fruit Batteries
Source Institutions
In this activity, learners create a battery from fruit. This activity helps learners explore electricity, electrochemistry, and series circuits as well as the process of scientific inquiry.
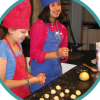
Piece It Together: Puzzle Hunt
Source Institutions
In this activity, learners follow clues to find five puzzle pieces, then assemble them. This activity works well with a whole group, individuals, or families.
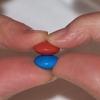
Survival of the Fittest: Battling Beetles
Source Institutions
This guided inquiry three-part activity engages learners in thinking about the mechanism of natural selection through data collection and pattern recognition.
Atoms and Matter (K-2)
Source Institutions
In this activity, learners explore atoms as the smallest building blocks of matter. With adult help, learners start by dividing play dough in half, over and over again.