Search Results
Showing results 41 to 52 of 52
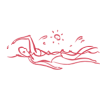
Why Circulate?
Source Institutions
In this activity related to the human circulatory system (on page 10 of the PDF), learners observe the dispersion of a drop of food coloring in water, draw conclusions about the movement of dissolved
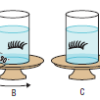
Visualizing How the Vestibular System Works
Source Institutions
In this activity (page 59 of the PDF), learners spin and observe false eyelashes in jars of water (prepared at least 1 day ahead of time) to investigate the effects of different types of motion on the
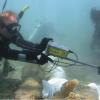
Excavating and Mapping Under Water
Source Institutions
In this archaeology activity, learners consider ways in which excavating an underwater site is different from excavating a terrestrial site.
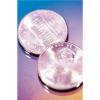
Statistics: Wet Heads
Source Institutions
In this math lesson, learners learn how to construct stem and leaf plots. Learners first estimate the number of drops of water that will fit on the head of a penny.
Number Sense and Computation: Soak It Up
Source Institutions
In this math lesson, learners compare products to determine the best product.
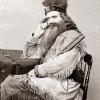
Mountain Man Measurement Rendezvous
Source Institutions
In this math lesson, learners participate in several activities where they apply measurement skills.

Avogadro's Bubbly Adventure
Source Institutions
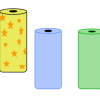
In this activity on page 7 of the PDF, learners investigate the solubility of gas in water at different temperatures. This experiment will help learners determine if temperature affects solubility.

Sustainable Grazing
Source Institutions
In this activity, learners investigate the food, water, and space needs of common livestock animals.
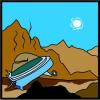
Chances Are: OH NO! Look Out Below for a UFO
Source Institutions
In this math lesson (on Page 13), learners predict and simulate the likelihood of an event occurring.

Arctic Sea Ice
Source Institutions
In this activity, learners explore how the area of Arctic sea ice has changed over recent years. First, learners graph the area of Arctic sea ice over time from 1979 to 2007.

Mapping Sea Level Rise
Source Institutions
In this activity related to climate change, learners create and explore topographical maps as a means of studying sea level rise.
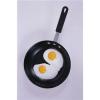
Biochemistry Happens Inside of You!
Source Institutions
In this four-part activity, learners explore how the body works and the chemistry that happens inside living things.