Search Results
Showing results 1 to 18 of 18
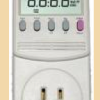
Plugged in to CO2
Source Institutions
In this activity, learners investigate various appliances and electronics, discovering how much energy each uses and how much carbon dioxide (CO2) is released to produce that energy.
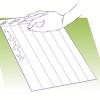
Growing Plants: Track Their Growth
Source Institutions
In this activity, learners will be working with predictions with a time frame of one week, or longer. Start by planting seedlings.

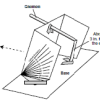
Whose Fault Is It?
Source Institutions
In this seismic simulation, learners play a "who-dunnit" game to explore earthquakes.

Arctic Sea Ice
Source Institutions
In this activity, learners explore how the area of Arctic sea ice has changed over recent years. First, learners graph the area of Arctic sea ice over time from 1979 to 2007.

Living Clocks
Source Institutions
In this activity about daily rhythms (on page 17 of the PDF), learners will explore circadian patterns in humans, animals and plants.
Using a Sundial
Source Institutions
In this activity (on page 12 of the PDF), learners make a sundial (shadow clock) appropriate for their geographic location in the northern hemisphere and use it to tell time.
Waves and Tides
Source Institutions
In this 7-10 day investigation, learners develop an understanding of waves and tides and their motion through discussion, demonstration, and hands-on activities.
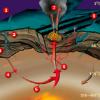
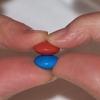
Candy Chemosynthesis
Source Institutions
In this activity, groups of learners work together to create edible models of chemicals involved in autotrophic nutrition.

The Daily Ups and Downs
Source Institutions
In this activity, learners graph 48 hourly air temperatures from a local weather observation site and observe the diurnal temperature variations.
Plenty on the Plains
Source Institutions
In this activity, learners compare the ways of life of Plains Native Americans who hunted and moved frequently to follow the buffalo herds, and Native Americans who farmed and lived in more permanent
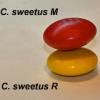
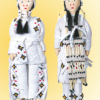
Survival of the Fittest: Variations in the Clam Species Clamys sweetus
Source Institutions
This guided inquiry three-part activity engages learners in thinking about the mechanism of natural selection by encouraging them to formulate questions that can be answered through scientific investi
Survival of the Fittest: Battling Beetles
Source Institutions
This guided inquiry three-part activity engages learners in thinking about the mechanism of natural selection through data collection and pattern recognition.
Waves: An Alternative Energy Source
Source Institutions
In this data analysis and environmental science activity, learners evaluate the feasibility of wave energy as a practical alternative energy source using ocean observing system (OOS) buoys.
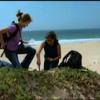
Sand Dunes
Source Institutions
This outdoor activity (on page 2 of the PDF under SciGirls Activity: Sand Dunes) is a full inquiry investigation into how the amount of moisture in a sand dune relates to the number of plants growing
Off Base
Source Institutions
In this activity, learners explore the factors that tend to resist changes in pH of the ocean and why the ocean is becoming more acidic.
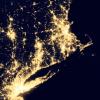
Where Do We Choose to Live and Why?
Source Institutions
In this geography investigation, learners use a nighttime satellite image to observe areas of light across the United States and to identify patterns and spatial distributions of human settlements.
Sea Turtle Populations
Source Institutions
In this activity (on page 2 of PDF under GPS: Sea Turtles Activity), learners will model how a sea turtle population changes over time, from eggs to adults, using puffed rice.
Make Your Own Weather Station
Source Institutions
This three-part activity shows learners how to build three meteorology tools: a wind vane, a rain gauge, and a barometer.