Search Results
Showing results 261 to 280 of 330
Mystery of the Disappearing Cottonwoods
Source Institutions
Learners will explore the scientific mystery behind a disappearing group of trees by examining data and attempting to explain the decline.

Arctic Sea Ice
Source Institutions
In this activity, learners explore how the area of Arctic sea ice has changed over recent years. First, learners graph the area of Arctic sea ice over time from 1979 to 2007.
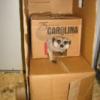
Animal House
Source Institutions
The goal of this activity is to design, build and test a house or toy for an animal.

It's a Gas, Man
Source Institutions
In this activity, learners discover if carbon dioxide has an effect on temperature.
Let's Count Humpback Whales: Environmental Effects on Population
Source Institutions
In this activity, learners use whale count data from the Hawaiian Islands Humpback Whale National Marine Sanctuary to compare whale counts in relation to environmental factors.
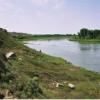
Coastal Erosion: Where's the Beach?
Source Institutions
Learners use beach profile data from a local beach or online data from Ocean City, Maryland to investigate coastal erosion and sediment transport.
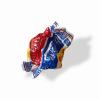
Wrap It Up!
Source Institutions
In this Energy and Environment activity (page 9 of the PDF), learners calculate the mass of a piece of gum, compare it to the mass of the gum's packaging, and then create a bar graph of the results.
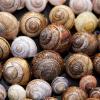
Measuring Biodiversity
Source Institutions
Learners use a variety of beans to represent a variety of species, and scatter these beans over a large piece of paper representing the environment.
Recycle Your Own Paper!
Source Institutions
In this activity (page 2 of PDF under GPS: Garbology Activity), learners will prepare sheets of homemade recycled paper from several different source pulps.
Keeping a Field Journal
Source Institutions
In this activity, learners start their own field journal to better understand the wildlife in their area.
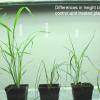
Effect of Environment on Plant Growth
Source Institutions
The purpose of this plant biotechnology activity is to demonstrate the effect of changes in the environment on the growth and fertility of landscape grasses and crop grasses such as wheat and rice.

A Cubic Foot Per Second
Source Institutions
In this activity, learners measure and calculate the amount of cubic feet various containers contain. Next, learners investigate cubic feet per second (cps), by carrying jugs in one second.
Trees: Buds and Twigs
Source Institutions
In this hands-on nature activity, learners observe the emergence of leaves and flowers. Branches from trees and bushes are collected in the early spring, brought indoors, and placed in water.
Blowin' in the Wind
Source Institutions
In this environmental engineering activity, learners build windmills using everyday items. The first challenge is to build windmills that spin when placed in front of a fan.
Earth's Water: A Drop in Your Cup
Source Institutions
This creative lesson plan provides a visual way for learners to gain knowledge about the finite amount of fresh water on Earth and encourages the discussion of the various ways to conserve this resour
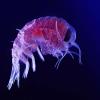
Amphipods: More than Mud
Source Institutions
In this data analysis and environmental science activity, learners examine the effects of pollution on amphipods using data from the Chesapeake Ecotox Research Program.

Sustainable Grazing
Source Institutions
In this activity, learners investigate the food, water, and space needs of common livestock animals.
Hexagon Hunt
Source Institutions
This activity gets learners looking at 6-sided shapes in nature, including the cells of a beehive, as well as other shapes.
Mapping Mockingbirds
Source Institutions
This lesson plan revolves around studying the speciation of the Galápagos mockingbirds, which are on display at the California Academy of Sciences.

Shake it up with Seismographs!
Source Institutions
In this activity, learners explore the engineering behind seismographs and how technology has improved accurate recording of earthquakes.