Search Results
Showing results 1 to 20 of 89
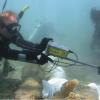
Excavating and Mapping Under Water
Source Institutions
In this archaeology activity, learners consider ways in which excavating an underwater site is different from excavating a terrestrial site.
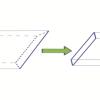
The Shape of Floatation
Source Institutions
In this activity (on page 2 of the PDF under GPS: Sailboat Design Activity), learners will discover how the shape of an object, not just its weight, determines whether it floats or sinks.
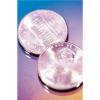
Statistics: Wet Heads
Source Institutions
In this math lesson, learners learn how to construct stem and leaf plots. Learners first estimate the number of drops of water that will fit on the head of a penny.
Kelsey: Clues of the Dig Site Map
Source Institutions
In this activity, learners explore dinosaur fossils and a dig site. Learners work in groups to analyze a dig site map and match bones to a skeletal drawing of Kelsey (a Triceratops).
Hold a Hill
Source Institutions
In this outdoor activity, learners investigate the relationship between the slope of a trail and soil erosion.
Making a One-Second Timer
Source Institutions
This lab activity has learners create a pendulum with a one-second period.

Incredible Shrinking Shapes
Source Institutions
In this activity, learners get hands-on experience with ratios and scaling while making their own jewelry out of recycled plastic containers.
Plot the Dot: A Graphical Approach to Density
Source Institutions
In this activity, learners work in groups to determine the mass and volume of four samples: glass marbles, steel washers or nuts, pieces of pine wood, and pieces of PVC pipe.
Now or Later: The "Recency/Primary" Effect
Source Institutions
In this activity (18th on the page), learners conduct an experiment to examine memory.
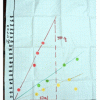
Linear Functions: Mystery Liquids
Source Institutions
In this math lesson, learners analyze the density of liquids in order to explore linear functions.

Arctic Sea Ice
Source Institutions
In this activity, learners explore how the area of Arctic sea ice has changed over recent years. First, learners graph the area of Arctic sea ice over time from 1979 to 2007.

Twirling in the Breeze
Source Institutions
In this engineering activity, learners build a device (an anemometer) to measure how fast the wind is blowing.
Exploring Structures
Source Institutions
This event guide features three related explorations in which learners investigate the following science concepts: how you design and build a structure helps determine how strong it will be; different
What Trickles Down?
Source Institutions
Learners design their own experiment to explore the permeability of different materials such as soil, sand, gravel, and marbles.
Serving Sizes
Source Institutions
In this nutrition and estimation activity (page 12 of PDF), learners estimate serving sizes of different foods and compare their estimates to serving size information provided on nutrition food labels
Giant Museum: Create a Scale Model
Source Institutions
In this activity, learners will predict the size of a giant scale model of a comb or other rectangular object, then make one. If you tripled the size of a dollar bill, could you sit on it?
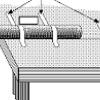
Balloon Hovercraft
Source Institutions
In this activity (on page 2 of the PDF under GPS: Luge Activity), learners will construct a model hovercraft out of an empty spool and a piece of cardboard.
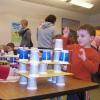
Soaring Towers: Building with Recycled Materials
Source Institutions
In this activity, learners will build the highest tower they can out of recycled materials.
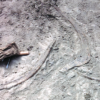
Relative Speed of Dinosaurs
Source Institutions
In this activity, learners interpret three trackways and use measurements and a formula to infer the relative speed of dinosaurs.
Silly Putty Investigation
Source Institutions
In this activity (located on page 7 of PDF), learners explore how Silly Putty was first invented and then attempt to make a batch of their own.