Search Results
Showing results 61 to 80 of 111

The Daily Ups and Downs
Source Institutions
In this activity, learners graph 48 hourly air temperatures from a local weather observation site and observe the diurnal temperature variations.

Dicey Directions
Source Institutions
In this game, learners are stuck in a right turn only world! Learners take turns rolling a die and moving their game pieces along the lines of a grid to get "home," by only making right turns.
Human Interface Design: The Chocolate Factory
Source Institutions
In this activity about human interface design issues, learners help the Oompa-Loompas of a great chocolate factory solve different problems.
Super Memory
Source Institutions
In this activity (pages 26-29 of the PDF), learners investigate how they can develop super memories by using mnemonic devices.
Haunted by Hurricanes: Use Data to Learn About Hurricanes
Source Institutions
In this activity, learners will determine if the frequency and intensity of hurricanes are changing using real data from the National Hurricane Center.
The Return of El Nino
Source Institutions
In this activity related to climate change and data analysis, learners examine temperature and precipitation data to determine if climate variations are due to El Niño.

Nano Scavenger Hunt
Source Institutions
This is an activity (located on page 3 of PDF under Where's Nano? Activity) about identifying nanoscale objects and phenomena in today's world.
Number Patterns
Source Institutions
In this lesson, learners are challenged to discover the relationship among six numbers.
Diatom Ooze: Ooze Clues
Source Institutions
In this activity, learners will plot the distribution of various oozes using information from sediment maps.
Conductivity: Salty Water
Source Institutions
Water, whether fresh or salty, serves as one of the best electrical conductors on the planet. Does salt effect its conductivity?
Life Size: Line 'em up!
Source Institutions
In this activity on page 1 of the PDF, learners compare the relative sizes of biological objects (like DNA and bacteria) that can't be seen by the naked eye.
The Ins and Outs of Tides: Learn About Causes and Predictions
Source Institutions
In this activity, learners will compare predicted and observed tides using data from The National Oceanic and Atmospheric Administration(NOAA).
Tsunami: Waves of Destruction
Source Institutions
In this activity, learners use tsunami time travel maps to predict how long it will take a tsunami to reach the shore.
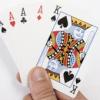
Two Sets!
Source Institutions
In this card game, learners make two sets of three cards that are alike. Learners must justify to the rest of the players why the three cards belong in each set.
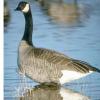
Canada Goose: Explore Trends With Data
Source Institutions
In this activity, learners will explore trends in Canada goose populations using real data from the National Audubon Society's Christmas Bird Count.

Guess My Rule
Source Institutions
In this math activity, learners play a game and try to be the first player to identify their partner's rule. Learners identify the rule by finding commonalities between three familiar objects.
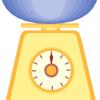
Heavy or Light
Source Institutions
In this activity, learners explore a scale by comparing objects, which look similar but have different weights. Learners predict and then measure the weights of various objects using a scale.
Harmful Algal Blooms: In Full Bloom
Source Institutions
In this activity, learners will investigate the impacts of harmful phytoplankton using NOAA's Coastal Services Center Harmful Algal Bloom Forecasting (HABF) Project data.

Atmospheric Collisions
Source Institutions
In this activity/demonstration, learners observe what happens when two ping pong balls are suspended in the air by a hair dryer. Use this activity to demonstrate how rain drops grow by coalescence.

The Shadow Knows I
Source Institutions
In this activity, learners will measure the length of their shadow from the Sun and compare it three to four months later.