Search Results
Showing results 121 to 140 of 250
Composting: A Scientific Investigation
Source Institutions
In this activity, learners conduct a scientific investigation involving decomposition and discover that the life cycle of trash is affected by its organic or inorganic nature.
Reflections
Source Institutions
In this quick activity, Dracula has a hole in his house and learners help solve the problem by using a mirror and protractor to reflect incoming light out of his house.
Narrow It Down: Asking Yes-No Questions
Source Institutions
In this activity, the learner asks yes-no questions to identify a secret object (similar to Twenty Questions). This game is easy to adapt for different ages and different kinds of contexts.
Patterns in Pixels
Source Institutions
This activity (page 2) draws upon a familiar, computer-based concept related to visual resolution: pixilation.
Animal Guess Who
Source Institutions
In this game, learners take turns guessing toy animals from around their house based on the toy's characteristics.

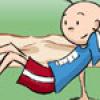
Crew Strength Training
Source Institutions
In this activity, learners will train to develop upper and lower body strength in their muscles and bones by performing body-weight squats and push-ups.
The Carbon Cycle and its Role in Climate Change: Activity 2
Source Institutions
In this activity (on page 7), learners explore the meaning of a "carbon sink." Using simple props, learners and/or an educator demonstrate how plants act as carbon sinks and how greenhouse gases cause
Slush Rush
Source Institutions
In this online game, learners run an outer space drink stand and thirsty alien customers are on the way.
A Pressing Engagement
Source Institutions
In this quick and easy activity and/or demonstration, learners illustrate the effect of the weight of air over our heads.

The Daily Ups and Downs
Source Institutions
In this activity, learners graph 48 hourly air temperatures from a local weather observation site and observe the diurnal temperature variations.
Exploring Measurement
Source Institutions
In this "Sid the Science Kid" activity, learners use their bodies to measure a room. Instead of inches or feet, how many kids does it take to measure the length of a room?
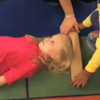
Half Full or Half Empty
Source Institutions
In this activity (12th activity on the page), learners conduct an experiment to demonstrate how muscles are constantly feeding information to the brain about what they are doing.
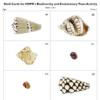
Biodiversity and Evolutionary Trees
Source Institutions
In this interactive activity, learners analyze seashells to explore phylogeny and evolution. Learners identify similar and dissimilar seashells to create a phylogenetic tree.
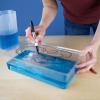
Exploring Earth: Rising Sea
Source Institutions
“Exploring Earth: Rising Sea” is a hands-on activity demonstrating ways to use topographical mapping techniques to track changes in sea level. The activity is connected to current NASA research.
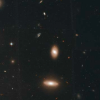
Coma Cluster of Galaxies
Source Institutions
In this activity, learners will first learn the basics of galaxy classification and grouping.
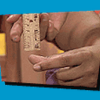
Reaction Time
Source Institutions
In this activity, learners conduct an experiment to test how fast they can react. Learners try to catch a piece of paper with a ruler printed on it (or a ruler) as quickly as they can.
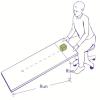
Static Friction Prediction
Source Institutions
In this activity (page 2 of PDF under GPS: Kinetic Sculpture Challenge Activity), learners will predict which objects have to overcome the most static friction to slide down a ramp.
Tsunami: Waves of Destruction
Source Institutions
In this activity, learners use tsunami time travel maps to predict how long it will take a tsunami to reach the shore.
Do a Spacewalk!
Source Institutions
In this activity, learners train to increase muscular strength and improve upper and lower body coordination by performing the “bear crawl” and the "crab walk.” Learners perform the exercises over tim
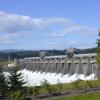
The Best Dam Simulation Ever
Source Institutions
This online simulation game explores the different consequences of water levels on the Columbia River in the Pacific Northwest.