Search Results
Showing results 1 to 20 of 25

Number Sense and Computation: Money Counts
Source Institutions
In this math lesson, learners count and compare amounts of money less than or equal to one dollar.
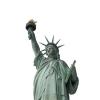
Measurement: How Many Noses Are in Your Arm?
Source Institutions
In this math lesson, learners apply the concepts of ratio and proportion to determine the length of the Statue of Liberty's torch-bearing arm.
Mercury in the Environment
Source Institutions
In this environmental science lesson, learners will examine the dangers of mercury and how humans contribute to growing mercury emissions on Earth.
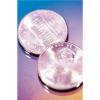
Statistics: Wet Heads
Source Institutions
In this math lesson, learners learn how to construct stem and leaf plots. Learners first estimate the number of drops of water that will fit on the head of a penny.
Inverse Functions: Pennies, Pressure, Temperature, and Light
Source Institutions
The major goal of this math lesson is to have learners collect data from a variety of experiments, determine what models best fits their data, and explain why their models are best.
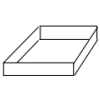
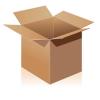
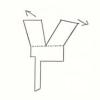
Polynomial and Rational Functions: Building Boxes
Source Institutions
In this math lesson, learners explore polynomial and rational function patterns.
Linear Functions: Mystery Liquids
Source Institutions
In this math lesson, learners analyze the density of liquids in order to explore linear functions.
Patterns and Relationships: Peddling Petals
Source Institutions
In this math lesson, learners use the setting of a flower-making fundraiser to explore a variety of patterns. Learners examine the patterns in a flower design made of triangles surrounding a square.
Quadratic Functions: Toothpicks and Transformations
Source Institutions
In this math lesson, learners explore transformations and quadratic functions through toothpick patterns.

Exponential Models: Rhinos and M&M’s ®
Source Institutions
In this math lesson, learners model exponential decay and exponential growth using M&M's, paper folding, and African rhino population data.
Number Sense and Computation: An Apple a Day
Source Institutions
In this math lesson, learners make estimates to analyze the number of apples per acre, and visualize the magnitude of one million.
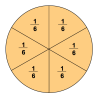
Number Sense and Computation: To Half or Half Not
Source Institutions
In this math lesson, learners use slices of bread and geoboards to explore several ways to divide a rectangle in half. Learners also identify equivalent fractions that represent one-half.

Tree-mendous Plots
Source Institutions
In this math lesson, learners record and graph plant growth and interpret data. Learners plant seeds, and once the seeds sprout, record the change in height of the plants for several days.
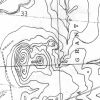
Blazing the Trail
Source Institutions
In this math lesson, learners estimate distances between landmarks and use a map and scales to determine the actual distances.

Multi-Variable Relations: Stressed to the Breaking Point
Source Institutions
In this math lesson, learners explore the relationship between the thickness of a spaghetti bridge, the length of the bridge, and the amount of weight that can be supported by the bridge.
Patterns and Relationships: The Magic Box
Source Institutions
In this math lesson, learners participate in a variety of activities that give them experience in recognizing, describing, and extending repeating and arithmetic patterns.
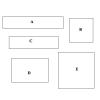
Geometry and Spatial Relations: It's a Perfect Fit
Source Institutions
In this three-part math activity, learners explore shapes. In part one, learners identify, describe, and classify two-dimensional shapes.
Rates of Change: Bottles and Divers
Source Institutions
In this math lesson (page 2 of the PDF), learners use bottles of various shapes to explore the abstract concept of rate of change.

Statistics: Steppin' Out
Source Institutions
In this math lesson, learners construct box-and-whisker plots to analyze and compare data sets. Learners investigate whether or not long-legged people run faster than short-legged people.
Statistics: Whirlybirds
Source Institutions
In this math lesson, learners measure, predict and determine the frequency of an event as it relates to how close Whirlybirds land to a target.