Search Results
Showing results 1 to 20 of 52
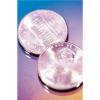
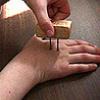
Statistics: Wet Heads
Source Institutions
In this math lesson, learners learn how to construct stem and leaf plots. Learners first estimate the number of drops of water that will fit on the head of a penny.
Our Sense of Sight: Color Vision
Source Institutions
In this activity, learners investigate color vision as well as plan and conduct their own experiments.
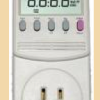
Plugged in to CO2
Source Institutions
In this activity, learners investigate various appliances and electronics, discovering how much energy each uses and how much carbon dioxide (CO2) is released to produce that energy.

Arctic Sea Ice
Source Institutions
In this activity, learners explore how the area of Arctic sea ice has changed over recent years. First, learners graph the area of Arctic sea ice over time from 1979 to 2007.
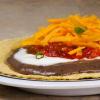
Creating Tostadas
Source Institutions
In this activity, learners develop their understanding of combinations as they create as many different kinds of tostadas as possible.
CyberOlympic Card Game
Source Institutions
In this Cyberchase activity, learners use numbers to create CyberOlympic teams with the fastest times.
Paint by the Numbers
Source Institutions
In this pencil and paper activity, learners work in pairs and simulate how astronomical spacecraft and computers create images of objects in space.
Throwing Pi
Source Institutions
In this calculus activity, learners use a classic problem of geometrical probability to find an important mathematical constant (pi).

Mapping Sea Level Rise
Source Institutions
In this activity related to climate change, learners create and explore topographical maps as a means of studying sea level rise.
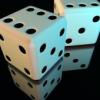
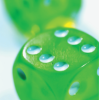
Dueling Dice
Source Institutions
In this activity, learners explore probability with dice.
Chances Are: OH NO! Look Out Below for a UFO
Source Institutions
In this math lesson (on Page 13), learners predict and simulate the likelihood of an event occurring.
Chances Are: It's a Mystery to Me
Source Institutions
In this math lesson, learners extend their understanding of basic probability concepts as they learn to name all of the possible outcomes of an event as well as ways to express the likelihood of such

Statistics: Steppin' Out
Source Institutions
In this math lesson, learners construct box-and-whisker plots to analyze and compare data sets. Learners investigate whether or not long-legged people run faster than short-legged people.
Probability: Chances Are
Source Institutions
In this math lesson, learners identify the likelihood of an event by using a walk-on probability scale.
Treasure Hunters
Source Institutions
Learners use their opponent's clues and a compass rose to find the hidden treasure on a map. Learners use problem solving and coordinate grid skills as they hunt for treasure.
Our Sense of Touch: Two-Point Discrimination
Source Institutions
In this activity, learners investigate the touch sensory system and discover how to plan and carry out their own experiments.
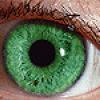
Our Sense of Sight: Eye Anatomy and Function
Source Institutions
In this activity, learners investigate the sense of sight and develop and conduct their own experiments.
Race to the Top
Source Institutions
In this math game (Page 6 of the Are You Game? PDF), learners examine the probability of rolling sums from 0 to 12 with two dice. The first player to reach the finish line is the winner.
Getting There!: Navigation and Trajectory
Source Institutions
In this two-part activity, learners map a navigation plan to get from Earth to Mars and back. In activity one, learners represent the orbital paths of Earth through dance and dramatic movement.
When Pigs Fly
Source Institutions
In this math lesson, learners explore probability.