Search Results
Showing results 1 to 20 of 22
Serving Sizes
Source Institutions
In this nutrition and estimation activity (page 12 of PDF), learners estimate serving sizes of different foods and compare their estimates to serving size information provided on nutrition food labels
Read the Label: Nutrition and Percentage
Source Institutions
This activity combines learning about nutrition, math of measurement and proportion, and healthy eating. Start by distributing food packages with Nutrition Facts labeled.
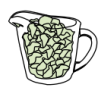
Many Seeds: Estimating Hidden Seeds
Source Institutions
In this activity, learners will estimate how many seeds are in a fruit or vegetable, then count to find out. The result: mix estimation with healthy eating.

Nutritional Challenges
Source Institutions
In this nutrition activity (page 26 of PDF), learners consider the nutritional needs of people with specific dietary requirements, such as athletes, persons with diabetes and vegetarians, and create a
Candy Chemosynthesis
Source Institutions
In this activity, groups of learners work together to create edible models of chemicals involved in autotrophic nutrition.

Servings and Choices
Source Institutions
In this nutrition activity (page 16 of PDF), learners document their individual eating habits and learn whether their eating patterns meet their needs.
Do Plants Need Light?
Source Institutions
In this food science activity, learners conduct an experiment that demonstrates the importance of light to plants.

Create a Pasta Population Map
Source Institutions
Learners work as a group to create a map of their community. They use pasta to represent people, and glue the pasta on their maps to show areas of large population.
Breakfast Sweets
Source Institutions
In this math activity, learners guess which cereals contain the most sugar. Learners use the nutrition labels on the cereal boxes to find the cereal with the least amount of sugar.

Work Up An Appetite
Source Institutions
In this activity, learners participate in fun movement activities while playing on a giant game board. Use this activity to get learners involved in physical activity.

Fraction Penguin
Source Institutions
In this craft activity, learners will recognize, name, and compare the fractions 1/2, 1/4, and 1/8 by constructing a penguin out of portions of paper circles.

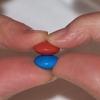
Exponential Models: Rhinos and M&M’s ®
Source Institutions
In this math lesson, learners model exponential decay and exponential growth using M&M's, paper folding, and African rhino population data.
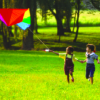
How Active Are You?
Source Institutions
In this activity, learners explore what is and is not active play and how it contributes to a healthy body and mind. Making active play a routine part of every day is a key concept of the experience.

The Scoop on Scallops
Source Institutions
In this data analysis activity, learners quantify the abundance and distribution of sea scallops in and adjacent to the Mid-Atlantic closed areas.

Statistics: Something Fishy
Source Institutions
In this math lesson, learners apply the concepts of ratio and proportion to the capture-recapture statistical procedure.

Chilean Sea Bass: Off the Menu
Source Institutions
In this data analysis activity, learners use data collected by the Commission for the Conservation of Antarctic Marine Living Resources (CCAMLR) to study Chilean sea bass populations.
Living Bones, Strong Bones
Source Institutions
In this activity about engineering, nutrition, and physical activity, learners design and build a healthy bone model of a space explorer which is strong enough to withstand increasing amounts of weigh
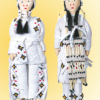
Plenty on the Plains
Source Institutions
In this activity, learners compare the ways of life of Plains Native Americans who hunted and moved frequently to follow the buffalo herds, and Native Americans who farmed and lived in more permanent
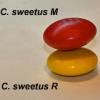
Survival of the Fittest: Variations in the Clam Species Clamys sweetus
Source Institutions
This guided inquiry three-part activity engages learners in thinking about the mechanism of natural selection by encouraging them to formulate questions that can be answered through scientific investi
Survival of the Fittest: Battling Beetles
Source Institutions
This guided inquiry three-part activity engages learners in thinking about the mechanism of natural selection through data collection and pattern recognition.