Search Results
Showing results 1 to 20 of 28
Bianca's Body Math
Source Institutions
In this Cyberchase activity, learners use math to explore how parts of the body are proportional.
Line Up: Using Math To Stand In Line
Source Institutions
Put math of measurement into lining up — and make waiting in line fun. Choose a size characteristic that learners can physically compare, such as foot length or hair length.
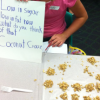
Breakfast Sweets
Source Institutions
In this math activity, learners guess which cereals contain the most sugar. Learners use the nutrition labels on the cereal boxes to find the cereal with the least amount of sugar.
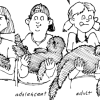
An Inventory of My Traits
Source Institutions
In this genetics meets math activity, learners take inventories of their own easily-observable genetic traits and compare those inventories with other learners in groups.
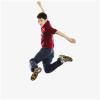
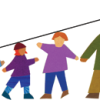
Stepping Out: Hop, Skip, Jump
Source Institutions
In this activity, learners explore and experiment how we can use our bodies everyday to get from one place to another.
Read the Label: Nutrition and Percentage
Source Institutions
This activity combines learning about nutrition, math of measurement and proportion, and healthy eating. Start by distributing food packages with Nutrition Facts labeled.
Inverse Square Law
Source Institutions
In this math activity related to light, learners explore why a light, such as a candle or a streetlight, looks dimmer the farther away from it we get.

Exponential Models: Rhinos and M&M’s ®
Source Institutions
In this math lesson, learners model exponential decay and exponential growth using M&M's, paper folding, and African rhino population data.

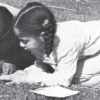
Statistics: Steppin' Out
Source Institutions
In this math lesson, learners construct box-and-whisker plots to analyze and compare data sets. Learners investigate whether or not long-legged people run faster than short-legged people.
Otter Smorgasbord
Source Institutions
In this graphing activity (on pages 33-40), learners investigate how much and what kinds of food sea otter pups eat during their first year of life.
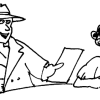
Medical Mystery
Source Institutions
This activity (on pages 15-23) combines interactive role-playing and graphing to introduce learners to the health affects of pollen.
Science Cooks!
Source Institutions
In this health, cooking, and math activity, learners explore nutrition and examine nutrition labels.

Tree-mendous Plots
Source Institutions
In this math lesson, learners record and graph plant growth and interpret data. Learners plant seeds, and once the seeds sprout, record the change in height of the plants for several days.
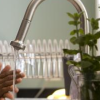
Home Water Audit
Source Institutions
This activity offers learners and their families several ways to raise their awareness together about home water.
Statistics: Creature Features
Source Institutions
In this math activity, learners collect, organize, and analyze a set of data related to types of animals in the temperate forest.
Bean Bugs
Source Institutions
In this outdoor biology and math activity, learners estimate the size of a population of organisms too numerous to count.

Statistics: Something Fishy
Source Institutions
In this math lesson, learners apply the concepts of ratio and proportion to the capture-recapture statistical procedure.
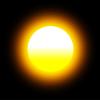
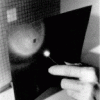
Oil Spot Photometer
Source Institutions
In this math activity related to light, learners assemble a photometer and use it to estimate the power output of the Sun.

Sustainable Grazing
Source Institutions
In this activity, learners investigate the food, water, and space needs of common livestock animals.
Hold a Hill
Source Institutions
In this outdoor activity, learners investigate the relationship between the slope of a trail and soil erosion.