Search Results
Showing results 1 to 20 of 30
Sea State: Forecast Conditions at Sea
Source Institutions
In this oceanography and data collection activity, learners cast real time sea state conditions using buoys from NOAA's National Data Buoy Center.
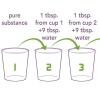
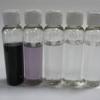
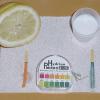
Forwards and Backwards: pH and Indicators
Source Institutions
Visitors prepare six solutions combining vinegar and ammonia that range incrementally from acid (all vinegar) to base (all ammonia).
Sniffing for a Billionth
Source Institutions
This is an activity (located on page 4 of the PDF under What's Nano? Activity) about size and scale.
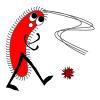
Comparing Sizes of Microorganisms
Source Institutions
In this activity related to microbes, learners create scale models of microorganisms and compare relative sizes of common bacteria, viruses, fungi and protozoa using metric measures: meters, centimete
Size Wheel
Source Institutions
In this fun sticker activity, learners will create a size wheel with images of objects of different size, from macroscopic scale (like an ant) to nanoscale (like DNA).

A Merry-Go-Round for Dirty Air
Learners build a model of a pollution control device--a cyclone. A cyclone works by whirling the polluted air in a circle and accumulating particles on the edges of the container.
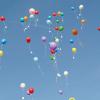
Cleaning Air with Balloons
Learners observe a simple balloon model of an electrostatic precipitator. These devices are used for pollutant recovery in cleaning industrial air pollution.
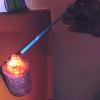
Hot Stuff!: Carbon Dioxide Extinguishes a Flame
In this demonstration, learners observe vinegar and baking soda creating carbon dioxide (CO2) in a bottle. The gas is poured out of a bottle onto a candle flame, putting out the candle.

Dripping Wet or Dry as a Bone?
Learners investigate the concept of humidity by using a dry and wet sponge as a model. They determine a model for 100% humidity, a sponge saturated with water.

Good News: We're on the Rise!
Learners build a simple aneroid barometer to learn about changes in barometric pressure and weather forecasting. They observe their barometer and record data over a period of days.

Hot Stuff!: Testing for Carbon Dioxide from Our Own Breath
Learners blow into balloons and collect their breath--carbon dioxide gas (CO2). They then blow the CO2 from the balloon into a solution of acid-base indicator.
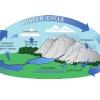
Moving Without Wheels
In a class demonstration, learners observe a simple water cycle model to better understand its role in pollutant transport.
Exploring Size: Scented Solutions
Source Institutions
This is an activity in which learners will find that they can detect differences in concentration better with their nose (smelling) than with their eyes (seeing).
Turning the Air Upside Down: Spinning Snakes
Learners color and cut out a spiral-shaped snake. When they hang their snake over a radiator, the snake spins.
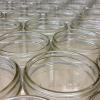
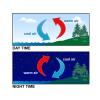
Hot Stuff!: Investigation #4
Learners test two jars containing soil, one covered and one open, for changes in temperature. After placing the jars in the Sun, learners discover that the covered jar cools down more slowly.
Acid (and Base) Rainbows
Learners use red cabbage juice and pH indicator paper to test the acidity and basicity of household materials. The activity links this concept of acids and bases to acid rain and other pollutants.

Acid Rain Effects
Learners conduct a simple experiment to model and explore the harmful effects of acid rain (vinegar) on living (green leaf and eggshell) and non-living (paper clip) objects.

Hot Stuff!: Creating and Testing for Carbon Dioxide
In this demonstration, learners observe vinegar and baking soda reacting to form carbon dioxide (CO2) gas.

Hot Stuff!: Testing Ice
In this demonstration, learners compare and contrast regular water ice to dry ice (frozen carbon dioxide). Both samples are placed in a solution of acid-base indicator.

Hot Stuff!: Investigation #2
Learners test two jars containing hot water, one covered with plastic and one open, for changes in temperature.