Search Results
Showing results 1 to 17 of 17
Serving Sizes
Source Institutions
In this nutrition and estimation activity (page 12 of PDF), learners estimate serving sizes of different foods and compare their estimates to serving size information provided on nutrition food labels
Life Size: Line 'em up!
Source Institutions
In this activity on page 1 of the PDF, learners compare the relative sizes of biological objects (like DNA and bacteria) that can't be seen by the naked eye.
Smaller Than You Think
Source Institutions
Learners compare a life-size drawing of a Tyrannosaurus rex head and a full-size Sinornithosaurus body to understand that dinosaurs varied in size.
Size Wheel
Source Institutions
In this fun sticker activity, learners will create a size wheel with images of objects of different size, from macroscopic scale (like an ant) to nanoscale (like DNA).
Comparing Sizes of Microorganisms
Source Institutions
In this activity related to microbes, learners create scale models of microorganisms and compare relative sizes of common bacteria, viruses, fungi and protozoa using metric measures: meters, centimete

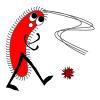
Life Size: What's in a microbe?
Source Institutions
In this activity on page 3 of the PDF, learners visualize the relative size and structural differences between microbes that have the potential to cause disease.
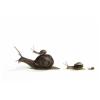
Small Snails, Enormous Elephants
Source Institutions
This activity (located on page 2 of PDF) introduces learners to the real size of animals using nonstandard measurement.
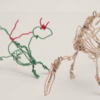
Size, Scale and Models
Source Institutions
In this activity, learners take measurements and create charts to learn about the size of dinosaurs and their relative scale to humans.
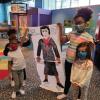
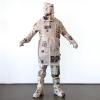
Body Biographies
Source Institutions
In this activity, learners will learn about a person they admire (famous, family or otherwise) or even themselves and create a life-sized silhouette.
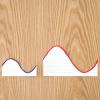
Soap-Film Interference Model: Get on our wavelength!
Source Institutions
By making models of light waves with paper, learners can understand why different colors appear in bubbles.
Read the Label: Nutrition and Percentage
Source Institutions
This activity combines learning about nutrition, math of measurement and proportion, and healthy eating. Start by distributing food packages with Nutrition Facts labeled.
Servings and Choices
Source Institutions
In this nutrition activity (page 16 of PDF), learners document their individual eating habits and learn whether their eating patterns meet their needs.
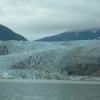
Moving Model Glacier
Source Institutions
In this goopy activity (page 2 of PDF under GPS: Glaciers Activity), learners will model glacial movement with “gak,” a white glue and liquid starch mixture.
Sea Turtle Populations
Source Institutions
In this activity (on page 2 of PDF under GPS: Sea Turtles Activity), learners will model how a sea turtle population changes over time, from eggs to adults, using puffed rice.
Bean Bugs
Source Institutions
In this outdoor biology and math activity, learners estimate the size of a population of organisms too numerous to count.
Our Sense of Sight: How We Perceive Movement, Depth and Illusions
Source Institutions
In this activity, learners investigate visual perception as well as plan and conduct their own experiments.