Search Results
Showing results 141 to 160 of 204
Not Just A Bag Of Beans
Source Institutions
In this activity, learners count and measure kidney beans to explore natural selection and variation. Learners measure the length of 50-100 beans.
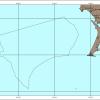
West Coast Shipwrecks
Source Institutions
In this data activity, learners will explore shipwrecks from four National Marine Sanctuaries on the West Coast of the United States.
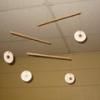
Rotational Equilibrium
Source Institutions
In this activity, learners explore the concept of rotational equilibrium. Learners work in teams to estimate and determine the force within a mobile design.
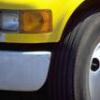
How the Rubber Meets the Road
Source Institutions
In this activity, learners explore how engineers design tire treads to increase safety and reliability.
Homemade Rube Goldberg Machine
Source Institutions
In this fun and, at times, hilarious force and motion activity, learners will use household objects to build a crazy contraption and see how far they can get a tennis ball to move.
Detect Solar Storms
Source Institutions
In this activity, learners build their own magnetometer using an empty soda bottle, magnets, laser pointer, and household objects.
The Blue Crab's Chesapeake Journey
Source Institutions
In this data collection activity about crabs, learners use data from the Virginia Institute of Marine Science (VIMS) trawl survey to determine the areas of the Chesapeake Bay that are being used by bl
Tsunami: Waves of Destruction
Source Institutions
In this activity, learners use tsunami time travel maps to predict how long it will take a tsunami to reach the shore.
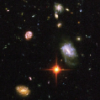
Telescopes as Time Machines
Source Institutions
This fun, nighttime hands-on astronomy activity lets learners explore how long it takes for light from different objects in the universe to reach Earth.
Sizing Up Temperature
Source Institutions
In this activity, learners explore Charles' Law in a syringe.
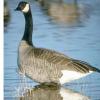
Canada Goose: Explore Trends With Data
Source Institutions
In this activity, learners will explore trends in Canada goose populations using real data from the National Audubon Society's Christmas Bird Count.
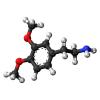
Ionic Bonding Puzzle Lab
Source Institutions
In this activity, learners create models of ionic compounds and observe the chemical formula of binary molecules they have created.
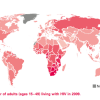
Mapping the Spread of HIV/AIDS: Trailing the Pandemic
Source Institutions
In this activity, learners act as epidemiologists by mapping the prevalence of HIV/AIDS worldwide.
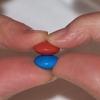
Number of Mentos vs. Height: Soda Geyser Series #5
Source Institutions
In this activity, learners conduct a controlled experiment to examine how many Mentos are needed to make the tallest possible soda geyser.
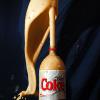
Soda Brand vs. Height Experiment: Soda Geyser Series #4
Source Institutions
In this activity, learners conduct a controlled experiment to examine which brand of soda makes the best (highest) soda geyser.
Survival of the Fittest: Battling Beetles
Source Institutions
This guided inquiry three-part activity engages learners in thinking about the mechanism of natural selection through data collection and pattern recognition.
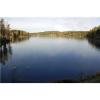
Water Walk
Source Institutions
Learners take a field trip along a local body of water and conduct a visual survey to discover information about local land use and water quality.
Harmful Algal Blooms: In Full Bloom
Source Institutions
In this activity, learners will investigate the impacts of harmful phytoplankton using NOAA's Coastal Services Center Harmful Algal Bloom Forecasting (HABF) Project data.
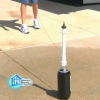
Paper Tape Motion Timer
Source Institutions
In this activity, learners build a recording timer made from simple materials (e.g., small dc motor, sharpie pen, craft sticks, adding machine paper tape, etc.).

Stroboscope
Source Institutions
In this activity (posted on March 20, 2011), learners follow the steps to construct a stroboscope, a device that exploits the persistence of vision to make moving objects appear slow or stationary.