Search Results
Showing results 41 to 60 of 317

Whose Fault Is It?
Source Institutions
In this seismic simulation, learners play a "who-dunnit" game to explore earthquakes.
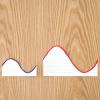
Graph Dance
Source Institutions
In this activity, learners "dance" (move back and forth at varying speeds) by reading a graph. This is a kinesthetic way to help learners interpret and understand how motion is graphed.

Arctic Sea Ice
Source Institutions
In this activity, learners explore how the area of Arctic sea ice has changed over recent years. First, learners graph the area of Arctic sea ice over time from 1979 to 2007.

Life Size: What's in a microbe?
Source Institutions
In this activity on page 3 of the PDF, learners visualize the relative size and structural differences between microbes that have the potential to cause disease.
Let's Count Humpback Whales: Environmental Effects on Population
Source Institutions
In this activity, learners use whale count data from the Hawaiian Islands Humpback Whale National Marine Sanctuary to compare whale counts in relation to environmental factors.
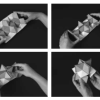
Exploring a Complex Space-Filling Shape
Source Institutions
In this activity, learners build a paper stellated rhombic dodecahedron, a three-dimensional 12-pointed star.
Arctic Story Puzzles
Source Institutions
This activity has three story puzzles learners can solve to learn about life in the Arctic.
Living Bones, Strong Bones
Source Institutions
In this activity about engineering, nutrition, and physical activity, learners design and build a healthy bone model of a space explorer which is strong enough to withstand increasing amounts of weigh
Bloomin' Bud Glyph
Source Institutions
In this math lesson, learners practice reading charts and graphs by creating and interpreting glyphs.
Eatem Up
Source Institutions
In this math activity, learners use gingerbread cookies to collect and organize simple data. First, learners read "The Gingerbread Boy" by Paul Galdone.

The Scoop on Scallops
Source Institutions
In this data analysis activity, learners quantify the abundance and distribution of sea scallops in and adjacent to the Mid-Atlantic closed areas.
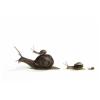
Small Snails, Enormous Elephants
Source Institutions
This activity (located on page 2 of PDF) introduces learners to the real size of animals using nonstandard measurement.
Starburst® Graph
Source Institutions
In this activity, learners use Starburst® candy to sort, classify, compare, and graph. Learners grab a handful of one-inch candy squares, sort them by color, graph the candy, and discuss the results.
Pass or Roll!
Source Institutions
In this math activity, learners play a game in which every roll can earn you counters, but if you roll the wrong number (6), you have to put everything back.
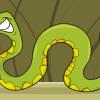
Animals are Amazing!
Source Institutions
In this activity, learners use measurement concepts to make models of what their body parts might look like if they were a snake or a chameleon.
Design a Lunar Rover!
Source Institutions
In this team design challenge (page 2-10 of PDF), learners design and build a model of a Lunar Transport Rover that will carry equipment and people on the surface of the Moon.
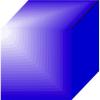
Scaling Cubes
Source Institutions
In this activity, learners explore scale by using building cubes to see how changing the length, width, and height of a three-dimensional object affects its surface area and its volume.
Soap-Film Interference Model: Get on our wavelength!
Source Institutions
By making models of light waves with paper, learners can understand why different colors appear in bubbles.
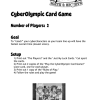
CyberOlympic Card Game
Source Institutions
In this Cyberchase activity, learners use numbers to create CyberOlympic teams with the fastest times.
Serving Sizes
Source Institutions
In this nutrition and estimation activity (page 12 of PDF), learners estimate serving sizes of different foods and compare their estimates to serving size information provided on nutrition food labels