Search Results
Showing results 1 to 20 of 21
Buckets of Popcorn
Source Institutions
In this activity, learners develop an understanding of cylinders and volume as they compare two sizes of popcorn buckets.
Measuring Rules
Source Institutions
In this math activity, learners create their own units of measurement by making noodle rulers. Learners practice estimating and measuring objects using the noodle rulers .

Mold Growth
Source Institutions
In this activity learners observe mold growth on different types of bread by measuring and recording the growth rate.
An Apple as Planet Earth
Source Institutions
In this environmental education demonstration (page 6 of the PDF), learners will see a tangible representation of the scarcity of soil resources on earth.

The Scoop on Scallops
Source Institutions
In this data analysis activity, learners quantify the abundance and distribution of sea scallops in and adjacent to the Mid-Atlantic closed areas.
Starburst® Graph
Source Institutions
In this activity, learners use Starburst® candy to sort, classify, compare, and graph. Learners grab a handful of one-inch candy squares, sort them by color, graph the candy, and discuss the results.
Ripening of Fruits and Vegetables
Source Institutions
In this activity, learners test the rate of ripening fruit and vegetables and use a chemical to inhibit the ripening process.

Build a Big Wheel
Source Institutions
In this activity, learners explore how engineers have developed big wheels or Ferris wheels.
Ship the Chip
Source Institutions
In this activity, learners explore engineering package designs that meet the needs of safely shipping a product.

Bake Sale
Source Institutions
This activity helps learners learn about math through a real-world scenario. Three friends are baking cookies for their school’s bake sale.
Exploring at the Nanoscale
Source Institutions
This lesson focuses on how nanotechnology has impacted our society and how engineers have learned to explore the world at the nanoscale.

Chilean Sea Bass: Off the Menu
Source Institutions
In this data analysis activity, learners use data collected by the Commission for the Conservation of Antarctic Marine Living Resources (CCAMLR) to study Chilean sea bass populations.
The Right Fit
Source Institutions
In this math activity, learners trace their hands and estimate the number of beans that can fit into their hand tracings. Then, learners glue the beans to the tracing to test out their estimations.
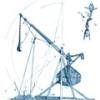
Trebuchet Toss
Source Institutions
In this activity, learners explore trebuchet design. Teams of learners construct trebuchets from everyday materials.

Multi-Variable Relations: Stressed to the Breaking Point
Source Institutions
In this math lesson, learners explore the relationship between the thickness of a spaghetti bridge, the length of the bridge, and the amount of weight that can be supported by the bridge.

Create a Pasta Population Map
Source Institutions
Learners work as a group to create a map of their community. They use pasta to represent people, and glue the pasta on their maps to show areas of large population.
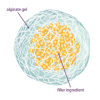
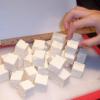
Self-Assembling Dessert Toppings
Source Institutions
This is an activity (located on page 3 of the PDF under Self-Assembly Activity) about self-assembly, the ability of molecules to assemble themselves according to certain rules.

Exponential Models: Rhinos and M&M’s ®
Source Institutions
In this math lesson, learners model exponential decay and exponential growth using M&M's, paper folding, and African rhino population data.
Maritime Munchies
Source Institutions
In this activity, learners follow simple historical maritime recipes to cook up hardtack and swanky, and then compare the foods they eat to what was served on ships in the past.

Statistics: Something Fishy
Source Institutions
In this math lesson, learners apply the concepts of ratio and proportion to the capture-recapture statistical procedure.