Search Results
Showing results 1 to 20 of 26
Measuring Rules
Source Institutions
In this math activity, learners create their own units of measurement by making noodle rulers. Learners practice estimating and measuring objects using the noodle rulers .
Eatem Up
Source Institutions
In this math activity, learners use gingerbread cookies to collect and organize simple data. First, learners read "The Gingerbread Boy" by Paul Galdone.

The Scoop on Scallops
Source Institutions
In this data analysis activity, learners quantify the abundance and distribution of sea scallops in and adjacent to the Mid-Atlantic closed areas.
Starburst® Graph
Source Institutions
In this activity, learners use Starburst® candy to sort, classify, compare, and graph. Learners grab a handful of one-inch candy squares, sort them by color, graph the candy, and discuss the results.
Serving Sizes
Source Institutions
In this nutrition and estimation activity (page 12 of PDF), learners estimate serving sizes of different foods and compare their estimates to serving size information provided on nutrition food labels
Joe's Place
Source Institutions
In this math activity (Page 8 of the Dining Out! PDF), younger learners select items from a menu and count out the total amount needed using the fewest bills and coins possible.

Bake Sale
Source Institutions
This activity helps learners learn about math through a real-world scenario. Three friends are baking cookies for their school’s bake sale.

Mapping Sea Level Rise
Source Institutions
In this activity related to climate change, learners create and explore topographical maps as a means of studying sea level rise.
The Menu Game at the Terribly Terrific Taco
Source Institutions
In this math game (Page 15 of the Dining Out! PDF), learners figure discounts and/or profit increases for various food totals. Learners add decimals to $100.

The Snack Shop
Source Institutions
In this math activity (Page 11 of the Dining Out! PDF), younger learners count out the total amount of money needed to purchase trail mix using the fewest number of bills/coins possible.
Number Sense and Computation: An Apple a Day
Source Institutions
In this math lesson, learners make estimates to analyze the number of apples per acre, and visualize the magnitude of one million.
Do Plants Need Light?
Source Institutions
In this food science activity, learners conduct an experiment that demonstrates the importance of light to plants.

The Gator Pie Game
Source Institutions
In this activity, learners explore fractions as they help gators share pies.

Chilean Sea Bass: Off the Menu
Source Institutions
In this data analysis activity, learners use data collected by the Commission for the Conservation of Antarctic Marine Living Resources (CCAMLR) to study Chilean sea bass populations.

Nutritional Challenges
Source Institutions
In this nutrition activity (page 26 of PDF), learners consider the nutritional needs of people with specific dietary requirements, such as athletes, persons with diabetes and vegetarians, and create a
Fair Shares: Predict Equal Shares
Source Institutions
Use this activity to build division and number sense into any snack time or whenever there is a limited set of things to share among a group: If we deal these out, could everyone get two pieces?
Many Seeds: Estimating Hidden Seeds
Source Institutions
In this activity, learners will estimate how many seeds are in a fruit or vegetable, then count to find out. The result: mix estimation with healthy eating.

Multi-Variable Relations: Stressed to the Breaking Point
Source Institutions
In this math lesson, learners explore the relationship between the thickness of a spaghetti bridge, the length of the bridge, and the amount of weight that can be supported by the bridge.

Create a Pasta Population Map
Source Institutions
Learners work as a group to create a map of their community. They use pasta to represent people, and glue the pasta on their maps to show areas of large population.
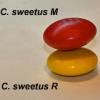
Survival of the Fittest: Variations in the Clam Species Clamys sweetus
Source Institutions
This guided inquiry three-part activity engages learners in thinking about the mechanism of natural selection by encouraging them to formulate questions that can be answered through scientific investi