Search Results
Showing results 1 to 20 of 73
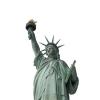
Measurement: How Many Noses Are in Your Arm?
Source Institutions
In this math lesson, learners apply the concepts of ratio and proportion to determine the length of the Statue of Liberty's torch-bearing arm.
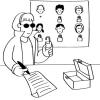
Public Key Encryption: Kid Krypto
Source Institutions
In this activity, learners conduct a simulation exercise related to public key encryption and try to intercept a message sent between two learners.
Battleships: Searching Algorithms
Source Institutions
This activity explores the main algorithms that are used as the basis for searching on computers, using different variations on the game of battleships.
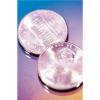
Statistics: Wet Heads
Source Institutions
In this math lesson, learners learn how to construct stem and leaf plots. Learners first estimate the number of drops of water that will fit on the head of a penny.
Stacking Dice
Source Institutions
In this math game, learners try to earn the most points by winning stacks of four dice. Learners practice number recognition and addition skills.
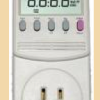
Plugged in to CO2
Source Institutions
In this activity, learners investigate various appliances and electronics, discovering how much energy each uses and how much carbon dioxide (CO2) is released to produce that energy.
Up and Down Donkey
Source Institutions
In this game, learners build up six stacks of cards in the middle of the table, face up, in order from 1 at the bottom to 20 on the top. The first player to get rid of all his cards is the winner.
Now or Later: The "Recency/Primary" Effect
Source Institutions
In this activity (18th on the page), learners conduct an experiment to examine memory.

Linear Functions: Mystery Liquids
Source Institutions
In this math lesson, learners analyze the density of liquids in order to explore linear functions.
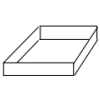
Polynomial and Rational Functions: Building Boxes
Source Institutions
In this math lesson, learners explore polynomial and rational function patterns.

Arctic Sea Ice
Source Institutions
In this activity, learners explore how the area of Arctic sea ice has changed over recent years. First, learners graph the area of Arctic sea ice over time from 1979 to 2007.
Arctic Story Puzzles
Source Institutions
This activity has three story puzzles learners can solve to learn about life in the Arctic.
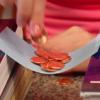
Penny Estimation
Source Institutions
In this math activity, learners estimate how many pennies are in a jar by predicting and counting handfuls of pennies.
Starburst® Graph
Source Institutions
In this activity, learners use Starburst® candy to sort, classify, compare, and graph. Learners grab a handful of one-inch candy squares, sort them by color, graph the candy, and discuss the results.
Calendarios para cualquier año
Source Institutions
Este Web site contiene links a 12 calendarios (12 meses). Cada mes contiene actividades sobre matemáticas.
Strengthen a Paper Bridge
Source Institutions
In this quick activity (page 1 of the PDF under SciGirls Activity: Tug O' War), learners will test how many pennies a flat paper index card bridging the gap between two stacks of books is able to supp
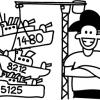
Soaring Towers: Building with Recycled Materials
Source Institutions
In this activity, learners will build the highest tower they can out of recycled materials.

Bake Sale
Source Institutions
This activity helps learners learn about math through a real-world scenario. Three friends are baking cookies for their school’s bake sale.
Relative Speed of Dinosaurs
Source Institutions
In this activity, learners interpret three trackways and use measurements and a formula to infer the relative speed of dinosaurs.
Understanding Albedo
Source Institutions
In this activity related to climate change, learners examine albedo and the ice albedo feedback effect as it relates to snow, ice, and the likely results of reduced snow and ice cover on global temper