Search Results
Showing results 1 to 20 of 26
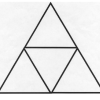
Geometry and Spatial Relations: Mirror, Mirror
Source Institutions
In this math lesson, learners use hinged mirrors to discover that regular polygons are composed of triangles tessellating around a center point.
Measurement: How Many Noses Are in Your Arm?
Source Institutions
In this math lesson, learners apply the concepts of ratio and proportion to determine the length of the Statue of Liberty's torch-bearing arm.
Mercury in the Environment
Source Institutions
In this environmental science lesson, learners will examine the dangers of mercury and how humans contribute to growing mercury emissions on Earth.
Statistics: Wet Heads
Source Institutions
In this math lesson, learners learn how to construct stem and leaf plots. Learners first estimate the number of drops of water that will fit on the head of a penny.
Inverse Functions: Pennies, Pressure, Temperature, and Light
Source Institutions
The major goal of this math lesson is to have learners collect data from a variety of experiments, determine what models best fits their data, and explain why their models are best.

Linear Functions: Mystery Liquids
Source Institutions
In this math lesson, learners analyze the density of liquids in order to explore linear functions.
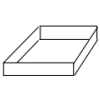
Polynomial and Rational Functions: Building Boxes
Source Institutions
In this math lesson, learners explore polynomial and rational function patterns.
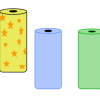
Number Sense and Computation: Soak It Up
Source Institutions
In this math lesson, learners compare products to determine the best product.
Geometry: Let's Face It
Source Institutions
In this math lesson, learners identify, describe, and construct the five regular polyhedra.
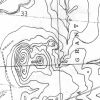
Blazing the Trail
Source Institutions
In this math lesson, learners estimate distances between landmarks and use a map and scales to determine the actual distances.
Number Sense and Computation: An Apple a Day
Source Institutions
In this math lesson, learners make estimates to analyze the number of apples per acre, and visualize the magnitude of one million.

Statistics: Steppin' Out
Source Institutions
In this math lesson, learners construct box-and-whisker plots to analyze and compare data sets. Learners investigate whether or not long-legged people run faster than short-legged people.
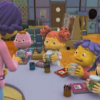
Estimation Exploration
Source Institutions
In this "Sid the Science Kid" activity from Episode 103: Enough With the Seashells!, learners practice estimating numbers of objects (like shells) and then check their estimates by counting.

Multi-Variable Relations: Stressed to the Breaking Point
Source Institutions
In this math lesson, learners explore the relationship between the thickness of a spaghetti bridge, the length of the bridge, and the amount of weight that can be supported by the bridge.
Number Sense and Computation: Food For Thought
Source Institutions
In this math lesson, learners identify and compare unit costs of given items. Learners use computation skills, problem solving and number sense to find the cost of an ounce of cereal.

Mix It Up
Source Institutions
In this math lesson, learners are introduced to proportional reasoning through modeling, sharing, and questioning techniques.
Patterns and Relationships: Struts 'n Stuff
Source Institutions
In this math lesson, learners identify the relationship between the number of sides in a regular polygon and the number of struts needed to make each polygon rigid.
Quadratic Functions: Toothpicks and Transformations
Source Institutions
In this math lesson, learners explore transformations and quadratic functions through toothpick patterns.

Exponential Models: Rhinos and M&M’s ®
Source Institutions
In this math lesson, learners model exponential decay and exponential growth using M&M's, paper folding, and African rhino population data.

Tree-mendous Plots
Source Institutions
In this math lesson, learners record and graph plant growth and interpret data. Learners plant seeds, and once the seeds sprout, record the change in height of the plants for several days.