Search Results
Showing results 161 to 180 of 225
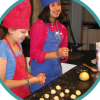
Cookie Surface Area
Source Institutions
This is an activity (on page 2 of the PDF under Surface Area Activity) about surface area to volume ratio.
Trees: Recorders of Climate Change
Source Institutions
In this activity, learners are introduced to tree rings by examining a cross section of a tree, also known as a “tree cookie.” They discover how tree age can be determined by studying the rings and ho

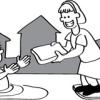
Zero-Energy Housing
In this activity, learners investigate passive solar building design with a focus solely on heating.
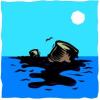
Oil Spill Cleanup
This hands-on experiment will provide learners with an understanding of the issues that surround environmental cleanup.

Drawing Conclusions
Source Institutions
In this weather forecasting activity, learners determine the location of cold and warm fronts on weather plot maps.
Signs of Change: Studying Tree Rings
Source Institutions
In this very hands-on lesson, learners will investigate dendrochronology (the study of tree rings to answer ecological questions about the recent past) and come up with conclusions as to what possible
Multiple Reflections
Source Institutions
In this activity, learners explore how mirrors reflect light and change the way we see things.

Exponential Models: Rhinos and M&M’s ®
Source Institutions
In this math lesson, learners model exponential decay and exponential growth using M&M's, paper folding, and African rhino population data.
The Muddy City: Minimal Spanning Trees
Source Institutions
In this puzzle, learners investigate the decisions involved in linking a network between houses in a muddy city.
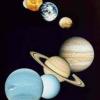
The Thousand-Yard Model
Source Institutions
This is a classic exercise for visualizing the scale of the Solar System.
Number Sense and Computation: To Half or Half Not
Source Institutions
In this math lesson, learners use slices of bread and geoboards to explore several ways to divide a rectangle in half. Learners also identify equivalent fractions that represent one-half.

Tree-mendous Plots
Source Institutions
In this math lesson, learners record and graph plant growth and interpret data. Learners plant seeds, and once the seeds sprout, record the change in height of the plants for several days.

Forward Thinking
Source Institutions
In this activity, learners create their own weather forecast map.
Waves: An Alternative Energy Source
Source Institutions
In this data analysis and environmental science activity, learners evaluate the feasibility of wave energy as a practical alternative energy source using ocean observing system (OOS) buoys.
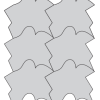
Making a Translation Tessellation
Source Institutions
In this activity, learners slide shapes to create unusual tiled patterns.
Phylogenetics
Source Institutions
This activity lets learners participate in the process of reconstructing a phylogenetic tree and introduces them to several core bioinformatics concepts, particularly in relation to evolution.

If Anyone Can, Icon
Source Institutions
In this activity, learners create their own icons for a forecast-at-a-glance poster for their classroom/learning space.
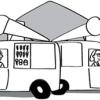
Tourist Town: Dominating Sets
Source Institutions
In this activity, learners use a fictitious map of "Tourist Town" and counters to problem solve how to place ice-cream vans on street intersections so that every other intersection is connected to one
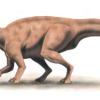
Dinosaur Flesh and Bones
Source Institutions
In this activity, learners explore dinosaur skeletons.
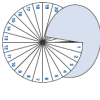
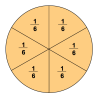
Sleep Patterns
Source Institutions
In this activity about sleep rhythms (on page 21 of the PDF), learners will collect data about their own sleep cycles and use a fraction wheel to examine their data.