Search Results
Showing results 41 to 60 of 317
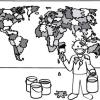
The Poor Cartographer: Graph Coloring
Source Institutions
In this activity, learners help a poor cartographer color in the countries on a map, making sure each country is colored a different color than any of its neighbors.
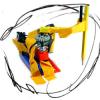
Pico Cricket Compass
Source Institutions
Learners can program a compass to draw a circle by itself using a Pico Cricket, some Legos, and lots of tape! Pico Cricket is required.
Paper Tape Motion Timer
Source Institutions
In this activity, learners build a recording timer made from simple materials (e.g., small dc motor, sharpie pen, craft sticks, adding machine paper tape, etc.).
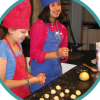
Breakfast Sweets
Source Institutions
In this math activity, learners guess which cereals contain the most sugar. Learners use the nutrition labels on the cereal boxes to find the cereal with the least amount of sugar.
Quadratic Functions: Toothpicks and Transformations
Source Institutions
In this math lesson, learners explore transformations and quadratic functions through toothpick patterns.
Cookie Surface Area
Source Institutions
This is an activity (on page 2 of the PDF under Surface Area Activity) about surface area to volume ratio.
Trees: Recorders of Climate Change
Source Institutions
In this activity, learners are introduced to tree rings by examining a cross section of a tree, also known as a “tree cookie.” They discover how tree age can be determined by studying the rings and ho

Zero-Energy Housing
In this activity, learners investigate passive solar building design with a focus solely on heating.
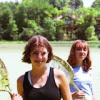
Malformed Frogs
Source Institutions
This activity (on page 2 of the PDF under SciGirls Activity: Malformed Frogs) is a full inquiry investigation into using indicator species to assess the health of an environment.
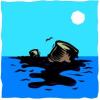
Oil Spill Cleanup
This hands-on experiment will provide learners with an understanding of the issues that surround environmental cleanup.

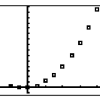
Exponential Models: Rhinos and M&M’s ®
Source Institutions
In this math lesson, learners model exponential decay and exponential growth using M&M's, paper folding, and African rhino population data.
The Muddy City: Minimal Spanning Trees
Source Institutions
In this puzzle, learners investigate the decisions involved in linking a network between houses in a muddy city.

Count the Dots: Binary Numbers
Source Institutions
Data in computers is stored and transmitted as a series of zeros and ones. Learners explore how to represent numbers using just these two symbols, through a binary system of cards.

Bake Sale
Source Institutions
This activity helps learners learn about math through a real-world scenario. Three friends are baking cookies for their school’s bake sale.

Mold Mole Molds
Source Institutions
In this activity, learners make different shapes that hold exactly one mole of gas (air).
Kites
Source Institutions
This activity (on page 2 of the PDF under SciGirls Activity: Kites) is a full inquiry investigation into how a kite’s shape affects its performance.
Plenty on the Plains
Source Institutions
In this activity, learners compare the ways of life of Plains Native Americans who hunted and moved frequently to follow the buffalo herds, and Native Americans who farmed and lived in more permanent
Double Dutch Distractions
Source Institutions
This activity (page 2 of the PDF under SciGirls Activity: Double Dutch) is a full inquiry investigation into whether hearing or seeing has a bigger effect on jump rope performance.
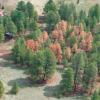
Bark Beetle Infestation Investigation: Estimation and Pheromones
Source Institutions
This activity investigates how bark beetles can threaten forests by having learners estimate the number of infected trees from a photo.
Measure Yourself in Nanometers
Source Institutions
In this activity, learners will be able to measure themselves in nanometers. A nanometer is a billionth of a meter, a unit of measurement used in nanotechnology.