Search Results
Showing results 1 to 20 of 71

Measurement: How Many Noses Are in Your Arm?
Source Institutions
In this math lesson, learners apply the concepts of ratio and proportion to determine the length of the Statue of Liberty's torch-bearing arm.

Measuring Your Breathing Frequency at Rest
Source Institutions
In this activity about the brain and sleep (on page 138 of the PDF), learners measure their resting breathing rates. Learners will discover that breathing frequencies vary amongst individuals.
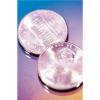
Statistics: Wet Heads
Source Institutions
In this math lesson, learners learn how to construct stem and leaf plots. Learners first estimate the number of drops of water that will fit on the head of a penny.
Hold a Hill
Source Institutions
In this outdoor activity, learners investigate the relationship between the slope of a trail and soil erosion.

Incredible Shrinking Shapes
Source Institutions
In this activity, learners get hands-on experience with ratios and scaling while making their own jewelry out of recycled plastic containers.
Bean Bugs
Source Institutions
In this outdoor biology and math activity, learners estimate the size of a population of organisms too numerous to count.
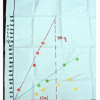
Plot the Dot: A Graphical Approach to Density
Source Institutions
In this activity, learners work in groups to determine the mass and volume of four samples: glass marbles, steel washers or nuts, pieces of pine wood, and pieces of PVC pipe.
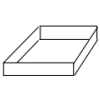
Polynomial and Rational Functions: Building Boxes
Source Institutions
In this math lesson, learners explore polynomial and rational function patterns.
Now or Later: The "Recency/Primary" Effect
Source Institutions
In this activity (18th on the page), learners conduct an experiment to examine memory.

Linear Functions: Mystery Liquids
Source Institutions
In this math lesson, learners analyze the density of liquids in order to explore linear functions.
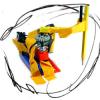
Pico Cricket Compass
Source Institutions
Learners can program a compass to draw a circle by itself using a Pico Cricket, some Legos, and lots of tape! Pico Cricket is required.
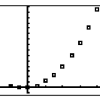
Quadratic Functions: Toothpicks and Transformations
Source Institutions
In this math lesson, learners explore transformations and quadratic functions through toothpick patterns.
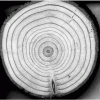
Trees: Recorders of Climate Change
Source Institutions
In this activity, learners are introduced to tree rings by examining a cross section of a tree, also known as a “tree cookie.” They discover how tree age can be determined by studying the rings and ho

Count the Dots: Binary Numbers
Source Institutions
Data in computers is stored and transmitted as a series of zeros and ones. Learners explore how to represent numbers using just these two symbols, through a binary system of cards.
Understanding Albedo
Source Institutions
In this activity related to climate change, learners examine albedo and the ice albedo feedback effect as it relates to snow, ice, and the likely results of reduced snow and ice cover on global temper
Mapping Sea Level Rise
Source Institutions
In this activity related to climate change, learners create and explore topographical maps as a means of studying sea level rise.
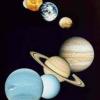
The Thousand-Yard Model
Source Institutions
This is a classic exercise for visualizing the scale of the Solar System.
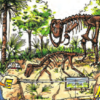
Dinosaur Interaction
Source Institutions
In this activity, learners explore why animals, specifically dinosaurs, live in families.
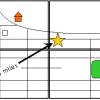
Solar System in My Neighborhood
Source Institutions
In this activity, learners shrink the scale of the vast solar system to the size of their neighborhood.

Mapping the Classroom
Source Institutions
In this activity, learners discover the importance of maps and scale as they work together to create a map of the classroom.
