Search Results
Showing results 1 to 20 of 72
Our Sense of Sight: Color Vision
Source Institutions
In this activity, learners investigate color vision as well as plan and conduct their own experiments.
Landing the Rover
Source Institutions
In this team design challenge (page 19-24 of PDF), learners "land" a model Lunar Rover in a model Landing Pod (both previously built in activities #3 and #4 in PDF).
Extreme Sounds
Source Institutions
This activity (on page 2 of the PDF under SciGirls Activity: Extreme Sounds) is a full inquiry investigation into sound.

How Quick Are Your Responses?
Source Institutions
In this activity (on page 134 of the PDF), learners explore reaction time.
Growing Plants: Track Their Growth
Source Institutions
In this activity, learners will be working with predictions with a time frame of one week, or longer. Start by planting seedlings.
Life Size: Line 'em up!
Source Institutions
In this activity on page 1 of the PDF, learners compare the relative sizes of biological objects (like DNA and bacteria) that can't be seen by the naked eye.
The Poor Cartographer: Graph Coloring
Source Institutions
In this activity, learners help a poor cartographer color in the countries on a map, making sure each country is colored a different color than any of its neighbors.
Pico Cricket Compass
Source Institutions
Learners can program a compass to draw a circle by itself using a Pico Cricket, some Legos, and lots of tape! Pico Cricket is required.
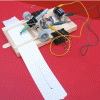
Paper Tape Motion Timer
Source Institutions
In this activity, learners build a recording timer made from simple materials (e.g., small dc motor, sharpie pen, craft sticks, adding machine paper tape, etc.).
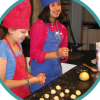
Cookie Surface Area
Source Institutions
This is an activity (on page 2 of the PDF under Surface Area Activity) about surface area to volume ratio.
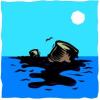
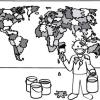
Oil Spill Cleanup
This hands-on experiment will provide learners with an understanding of the issues that surround environmental cleanup.
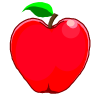
Number Sense and Computation: An Apple a Day
Source Institutions
In this math lesson, learners make estimates to analyze the number of apples per acre, and visualize the magnitude of one million.

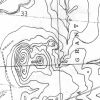
Mapping Sea Level Rise
Source Institutions
In this activity related to climate change, learners create and explore topographical maps as a means of studying sea level rise.
Blazing the Trail
Source Institutions
In this math lesson, learners estimate distances between landmarks and use a map and scales to determine the actual distances.
Our Sense of Sight: How We Perceive Movement, Depth and Illusions
Source Institutions
In this activity, learners investigate visual perception as well as plan and conduct their own experiments.
Human Interface Design: The Chocolate Factory
Source Institutions
In this activity about human interface design issues, learners help the Oompa-Loompas of a great chocolate factory solve different problems.
Classroom Dinosaur Dig
Source Institutions
In this activity, learners participate in a simulated dig to discover fossilized dinosaur bones. Learners take notes, make a map and propose theories about dinosaurs.
Gene Switches
Source Institutions
In this activity, learners explore how genetic switches function and the role of genetic switches in the process of evolution.
Signs of Change: Studying Tree Rings
Source Institutions
In this very hands-on lesson, learners will investigate dendrochronology (the study of tree rings to answer ecological questions about the recent past) and come up with conclusions as to what possible
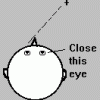
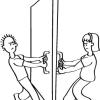
Multiple Reflections
Source Institutions
In this activity, learners explore how mirrors reflect light and change the way we see things.