Search Results
Showing results 1 to 20 of 93
Where Will It Go?
Source Institutions
In this activity, learners predict where a ball will go after it bounces off another object. Learners discover that the motion of objects is predictable based on laws of motion.
Disease Detective
Source Institutions
This activity (on pages 35-43) lets learners analyze a "herd of elk" to detect the spread of a bacterial disease called brucellosis.
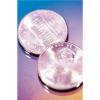
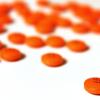
Statistics: Wet Heads
Source Institutions
In this math lesson, learners learn how to construct stem and leaf plots. Learners first estimate the number of drops of water that will fit on the head of a penny.
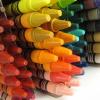
Our Sense of Sight: Color Vision
Source Institutions
In this activity, learners investigate color vision as well as plan and conduct their own experiments.
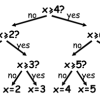
Twenty Guesses: Information Theory
Source Institutions
This activity introduces the idea that computer scientists measure information by how "surprising" a message is.
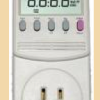
Plugged in to CO2
Source Institutions
In this activity, learners investigate various appliances and electronics, discovering how much energy each uses and how much carbon dioxide (CO2) is released to produce that energy.
Drugs, Risks and the Nervous System
Source Institutions
In this activity, learners estimate risks associated with different events and compare their estimates to the real possibilities.
What's the Difference?
Source Institutions
In this sorting activity, learners play a game in which they try to identify the largest number of differences between two objects.
Color Draw
Source Institutions
In this activity, learners use their understanding of probability to guess which color will be drawn from a bag.

What Shape Is It?
Source Institutions
In this activity, learners determine the shape of an unseen object by bouncing a ball off the object.
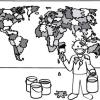
The Poor Cartographer: Graph Coloring
Source Institutions
In this activity, learners help a poor cartographer color in the countries on a map, making sure each country is colored a different color than any of its neighbors.
Weather Forecasting
Source Institutions
This activity (on page 2 of the PDF under SciGirls Activity: Forecasting) is a full inquiry investigation into meteorology and forecasting.

Exponential Models: Rhinos and M&M’s ®
Source Institutions
In this math lesson, learners model exponential decay and exponential growth using M&M's, paper folding, and African rhino population data.
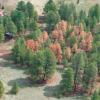
Bark Beetle Infestation Investigation: Estimation and Pheromones
Source Institutions
This activity investigates how bark beetles can threaten forests by having learners estimate the number of infected trees from a photo.
Chances Are: It's a Mystery to Me
Source Institutions
In this math lesson, learners extend their understanding of basic probability concepts as they learn to name all of the possible outcomes of an event as well as ways to express the likelihood of such
Throwing Pi
Source Institutions
In this calculus activity, learners use a classic problem of geometrical probability to find an important mathematical constant (pi).
Odd Man Out
Source Institutions
In this math game (Page 14 of the Are You Game? PDF), learners determine the probability of getting an even versus an odd product using the numbers on a regular deck of cards.

Mapping Sea Level Rise
Source Institutions
In this activity related to climate change, learners create and explore topographical maps as a means of studying sea level rise.
Tug-of-War
Source Institutions
This activity (on page 2 of the PDF under SciGirls Activity: Tug O' War) is a full inquiry investigation into tug-of-war physics. Groups of learners will test two tug-of-war strategies.
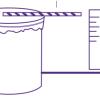
Pea Brain!: Explorations in Estimation
Source Institutions
In this activity, learners use two different techniques to estimate how many little things fit into one bigger thing.