Search Results
Showing results 1 to 18 of 18
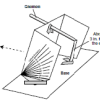
Going for a Spin: Making a Model Steam Turbine
Source Institutions
In this activity, learners explore how various energy sources can be used to cause a turbine to rotate.

The Scoop on Scallops
Source Institutions
In this data analysis activity, learners quantify the abundance and distribution of sea scallops in and adjacent to the Mid-Atlantic closed areas.
Woodlands Map
Source Institutions
This is a culminating activity which allows learners to summarize what they know about Woodlands Native Americans by creating illustrations and map symbols for a large outline map (see related Activit
Earth's Water: A Drop in Your Cup
Source Institutions
This creative lesson plan provides a visual way for learners to gain knowledge about the finite amount of fresh water on Earth and encourages the discussion of the various ways to conserve this resour

Mapping Sea Level Rise
Source Institutions
In this activity related to climate change, learners create and explore topographical maps as a means of studying sea level rise.
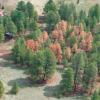
Bark Beetle Infestation Investigation: Estimation and Pheromones
Source Institutions
This activity investigates how bark beetles can threaten forests by having learners estimate the number of infected trees from a photo.

Living Clocks
Source Institutions
In this activity about daily rhythms (on page 17 of the PDF), learners will explore circadian patterns in humans, animals and plants.

Chilean Sea Bass: Off the Menu
Source Institutions
In this data analysis activity, learners use data collected by the Commission for the Conservation of Antarctic Marine Living Resources (CCAMLR) to study Chilean sea bass populations.
Using a Sundial
Source Institutions
In this activity (on page 12 of the PDF), learners make a sundial (shadow clock) appropriate for their geographic location in the northern hemisphere and use it to tell time.
Waves and Tides
Source Institutions
In this 7-10 day investigation, learners develop an understanding of waves and tides and their motion through discussion, demonstration, and hands-on activities.
To Topo Two
Source Institutions
In this activity, two groups of learners create two separate landform models out of clay (mountains and valleys).

What's the Difference between Weather and Climate?
Source Institutions
In this interactive and informative group activity, learners use packages of M&M's to illustrate the difference between weather and climate.
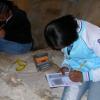
Fossil Age Estimation Model
Source Institutions
In this activity (page 1 of the PDF under SciGirls Activity: Dinosaurs), learners will model how paleontologists estimate the age of fossil discoveries by extracting “fossil” playing cards from newspa
Oil Spill Cleanup
This hands-on experiment will provide learners with an understanding of the issues that surround environmental cleanup.

If Anyone Can, Icon
Source Institutions
In this activity, learners create their own icons for a forecast-at-a-glance poster for their classroom/learning space.
Statistics: Creature Features
Source Institutions
In this math activity, learners collect, organize, and analyze a set of data related to types of animals in the temperate forest.
Earth's Water: A Drop in Your Cup
Source Institutions
This creative lesson plan provides a visual way for learners to gain knowledge about the finite amount of fresh water on Earth and encourages the discussion of the various ways to conserve this resour
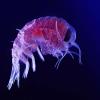
Amphipods: More than Mud
Source Institutions
In this data analysis and environmental science activity, learners examine the effects of pollution on amphipods using data from the Chesapeake Ecotox Research Program.