Search Results
Showing results 201 to 220 of 241
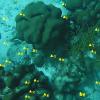
Coral Snapshots: Biodiversity in Marine Protected Areas
Source Institutions
In this data activity, learners analyze data from coral reef snapshots taken by scientists at the Virginia Institute of Marine Science.
To Topo Two
Source Institutions
In this activity, two groups of learners create two separate landform models out of clay (mountains and valleys).

Discovering Rainforest Locations
Source Institutions
In this activity, learners will examine various world data maps to combine the information and predict which areas could be tropical rainforests.
Aesop's Arithmetic
Source Institutions
In this activity (located on page 9 of the PDF), learners are introduced to Aesop's fable, "The Crow and the Pitcher." In the story, a clever crow drops pebbles into a pitcher to cause the water level
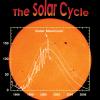
Solar Flip Book
Source Institutions
In this activity, learners make a flip book that shows the progression of two solar events on reversible sides of the flip book.
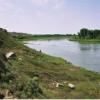
Mystery of the Disappearing Cottonwoods
Source Institutions
Learners will explore the scientific mystery behind a disappearing group of trees by examining data and attempting to explain the decline.
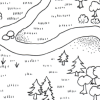
Mapping a Study Site
Source Institutions
In this outdoor activity, learners use a mapping technique to become oriented to the major features of an outdoor site.
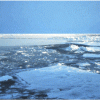
Arctic Sea Ice
Source Institutions
In this activity, learners explore how the area of Arctic sea ice has changed over recent years. First, learners graph the area of Arctic sea ice over time from 1979 to 2007.
Coastal Erosion: Where's the Beach?
Source Institutions
Learners use beach profile data from a local beach or online data from Ocean City, Maryland to investigate coastal erosion and sediment transport.
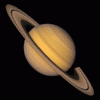
Build a Solar System
Source Institutions
In this activity, learners make a scale model of the Solar System and learn the real definition of "space." Learners use the online calculator to create an appropriate scale to use as a basis for thei

A Cubic Foot Per Second
Source Institutions
In this activity, learners measure and calculate the amount of cubic feet various containers contain. Next, learners investigate cubic feet per second (cps), by carrying jugs in one second.
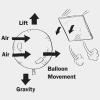
Sky Floater Challenge
Source Institutions
In this design challenge activity, learners make a balloon hover at eye level for five seconds, and then make it move by creating air currents.
The Crayon Rock Cycle
Source Institutions
In this activity, learners use crayons to draw conclusions about rocks and the rock cycle.
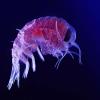
Amphipods: More than Mud
Source Institutions
In this data analysis and environmental science activity, learners examine the effects of pollution on amphipods using data from the Chesapeake Ecotox Research Program.
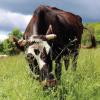
Sustainable Grazing
Source Institutions
In this activity, learners investigate the food, water, and space needs of common livestock animals.
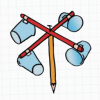
Twirling in the Breeze
Source Institutions
In this engineering activity, learners build a device (an anemometer) to measure how fast the wind is blowing.
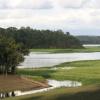
Amazon Water Cycle Roleplay
Source Institutions
In this creative roleplay activity, learners will explore the various processes of the water cycle using movement, sound, and props to aid in comprehension.
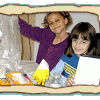
If Trash Could Talk
Source Institutions
Ancient trash tells archaeologists a lot about the past. In this activity, learners take a close look inside their trash can and think about the clues it offers about their lives.
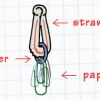
Deep Sea Diver
Source Institutions
In this ocean engineering activity, learners explore buoyancy and water displacement. Then, learners design models of deep sea divers that are neutrally buoyant.

A Hurricane's Storm Surge Affects our Estuaries
Source Institutions
In this activity, learners construct a coastal landmass from sand and add features such as tidal creeks and barrier islands.
